Homelab Elastic SIEM Installation
Document Intent
This is to serve is a guide for setting up an Elastic SIEM for homelab on your own hardware. Do note that if you have the resources available, it will probably be best to install Security Onion, which includes Elastic, rather than just an Elastic SIEM. This guide is designed for your SIEM to not be public facing, but to still expect others on your network. We will be following and referencing the official elastic documentation throughout this guide, but this guide will be more step by step than elastic’s documentation with the addition of recommended configurations throughout. Your resources will likely differ from mine, so feel free to also follow along with Elastic’s documentation for edge cases.
Other sources: This guide does exist both in markdown form on github and within video form on my YouTube channel if you prefer that
Note: My configuration takes place on one virtual machine with 12 GB of Ram and a 1000 GB hard drive (though you can likely get away with a lot less). This installation takes place on an Ubuntu 24.04 Server with a statically assigned IP address.
This guide will be broken up into the following parts:
Elastic Search Installation
Elastic Search’s Role
While I think it is important to know the role of each part of your SIEM, if you want to move forward with the installation then jump to the Installation step.
Elastic search is described as “an open source, distributed search and analytics engine built for speed, scale, and AI applications”. Which to put more simply, it is a platform to store and search logs with some programmatic features baked in. Elastic offers many different versions of the software running on different code languages, however the most common and the one we will be using is Java with a bundled in JDK. By default TLS encryption is enabled on the basic install of ES. To send logs to ES port 9200 will be opened on the host, however you can find more about firewall configurations in the Configuring the Firewall portion of this guide. To actually view these logs we will be using Elastic’s Kibana, which we will go into in its respective section.
Elastic Search Installation Steps
Luckily the installation of Elastic Search is pretty straight forward to the official installation guide provided by elastic which can be found here. We will primarily following this word for word.
-
Import the Elasticsearch PGP key:
$ wget -qO - https://artifacts.elastic.co/GPG-KEY-elasticsearch | sudo gpg --dearmor -o /usr/share/keyrings/elasticsearch-keyring.gpg -
Install apt transport https
$ sudo apt-get install apt-transport-https -
Save the repository definition
$ echo "deb [signed-by=/usr/share/keyrings/elasticsearch-keyring.gpg] https://artifacts.elastic.co/packages/9.x/apt stable main" | sudo tee /etc/apt/sources.list.d/elastic-9.x.list -
Update and install
$ sudo apt-get update && sudo apt-get install elasticsearch -
Observe the output of installing elastic search:
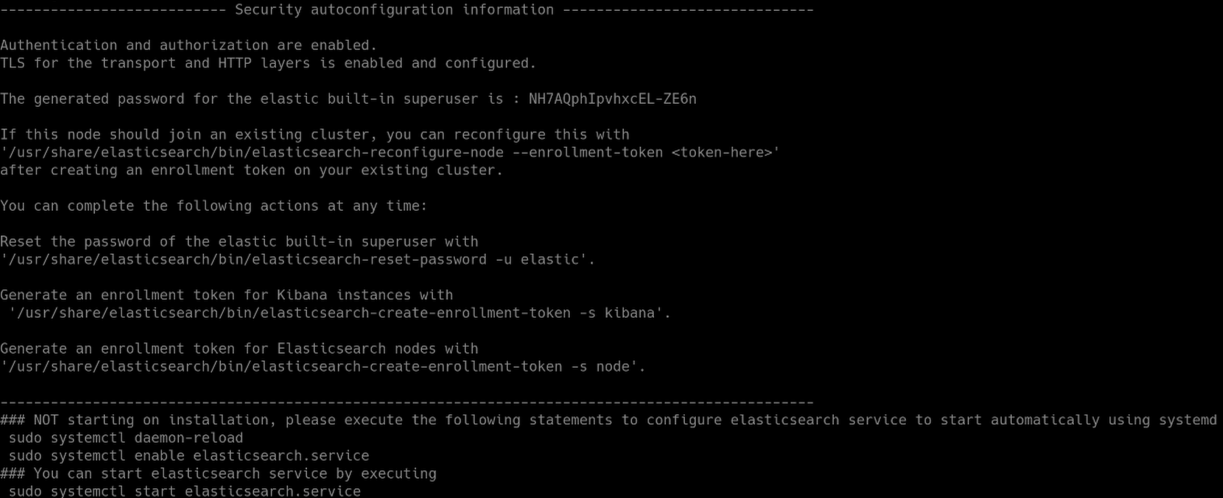 Here we can see in the output a password is generated for our build in user,
 NH7AQphIpvhxcEL-ZE6n. On your installation please keep note of this password. If you have lost this password then you will have to generate a new one with$ sudo /usr/share/elasticsearch/bin/elasticsearch-reset-password -u elasticor as your output directs you to. -
Now obtain your IP address then open
/etc/elasticsearch/elasticsearch.ymlin your text editor of choice. Uncomment the line#network.host: 192.168.0.1And change this to:network.host: <YOUR-IP>This will enable elastic search to listen on all interfaces. In addition add the following line below your newly created one:transport.host: <YOUR-IP>. -
Next enable systemd journal logging for the elasticsearch service by navigating to your elasticsearch.service file. In my case it is located at
/usr/lib/systemd/system/elasticsearch.serviceFind the lineExecStart=/usr/share/elasticsearch/bin/systemd-entrypoint -p ${PID_DIR}/elasticsearch.pid --quietand remove the
--quietpart from itExecStart=/usr/share/elasticsearch/bin/systemd-entrypoint -p ${PID_DIR}/elasticsearch.pid -
Finally, daemon-reload, enable and start the service
text$ sudo systemctl daemon-reload $ sudo systemctl enable elasticsearch.service $ sudo systemctl start elasticsearch.service$ sudo systemctl daemon-reload $ sudo systemctl enable elasticsearch.service $ sudo systemctl start elasticsearch.service
Verification
Luckily verification that the service is running is quite easy.
$ systemctl status elasticsearch.service
This command should display that the service is active and enabled as shown here: 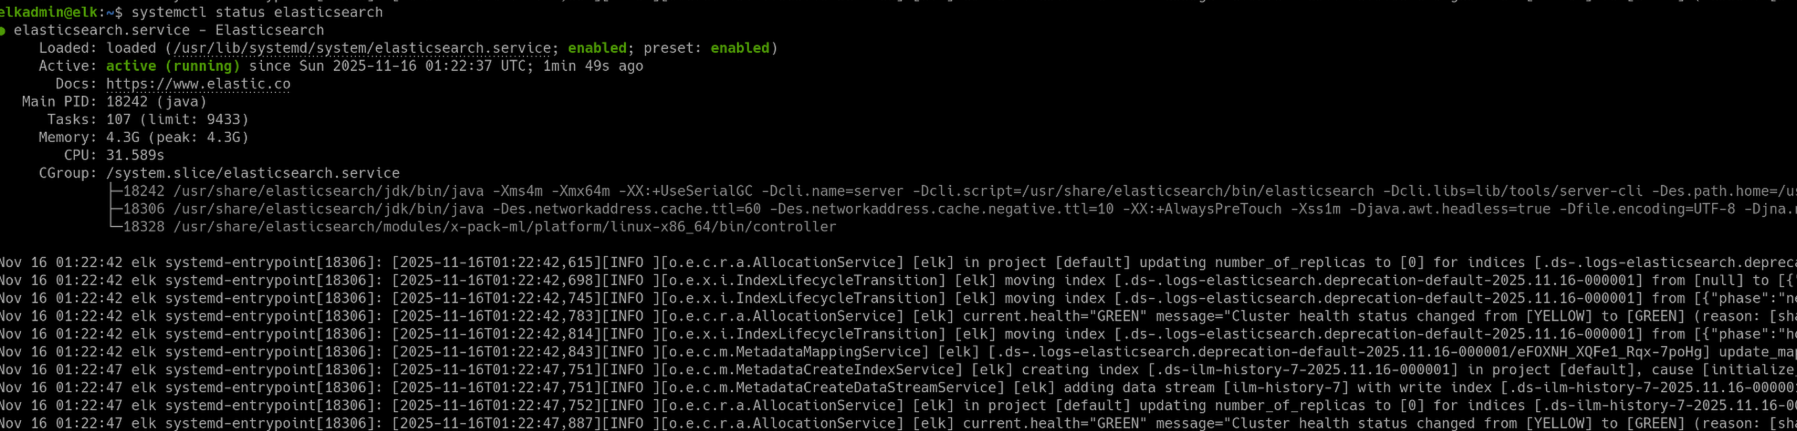 Afterwards you can verify that the service is able to receive information by querying it. For the following command please replace the elastic password with the one you had stored in step 5 of Elastic Search Installation Steps.
$ sudo curl --cacert /etc/elasticsearch/certs/http_ca.crt -u elastic:<ELASTIC-PASSWORD> https://localhost:9200
You should receive a response like the following: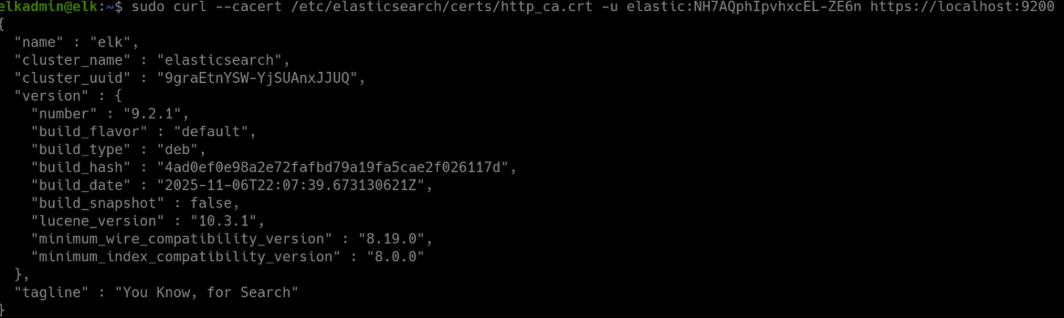
Congratulations, once you have successfully installed elastic search!
Kibana Installation
Kibana’s Role
Kibana will be the primary way you are able to interact with your SIEM.
Kibana is a web server that you host in order to view logs, setup fleets, create dashboards, and about everything else that you might want to do with your SIEM.
Kibana Installation Steps
-
Install the Kibana package:
$ sudo apt-get install kibana -
Make the host externally accessible, modifying
/etc/kibana/kibana.ymland changing the line#server.host: "localhost"toserver.host: <YOUR-IP> -
Now setup and start Kibana with systemd
text$ sudo systemctl daemon-reload $ sudo systemctl enable kibana $ sudo systemctl start kibana$ sudo systemctl daemon-reload $ sudo systemctl enable kibana $ sudo systemctl start kibana -
Next enroll Kibana, obtain the verification code via the command:
$ systemctl status kibanaThat will show an output like so:
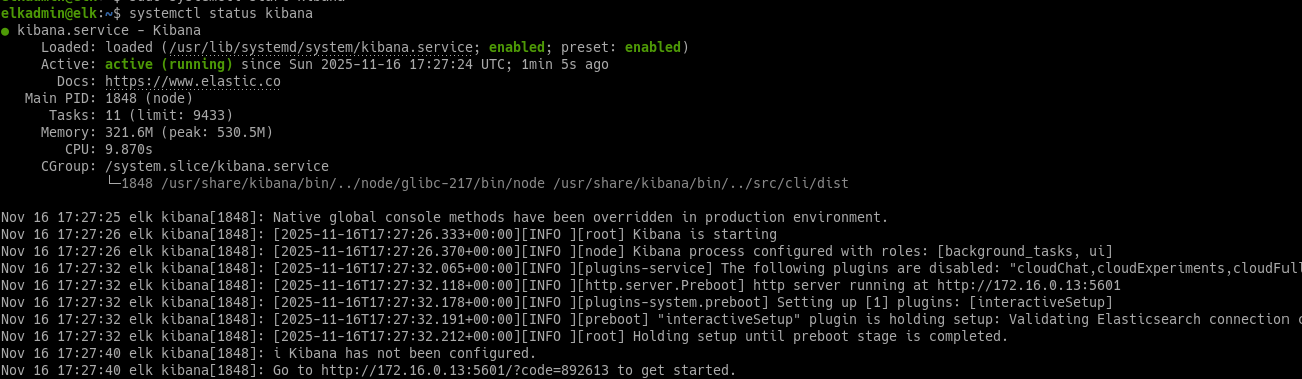 At the bottom we will see text like the following:
Go to http://172.16.0.13:5601/?code=892613 to get started.Visit the URL provided in your web browser to enable your Kibana instance. Next, you will see a page prompting you for an enrollment token:
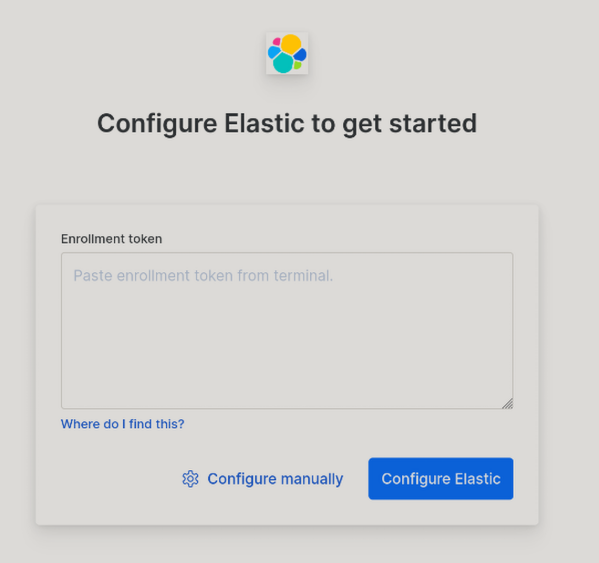
Generate an enrollment token with the following command
$ sudo /usr/share/elasticsearch/bin/elasticsearch-create-enrollment-token -s kibanaCopy the output of that command and paste it into the Enrollment token window on your browser, then click “Configure Elastic”. Please give Kibana a moment until you are able to see the following login page:
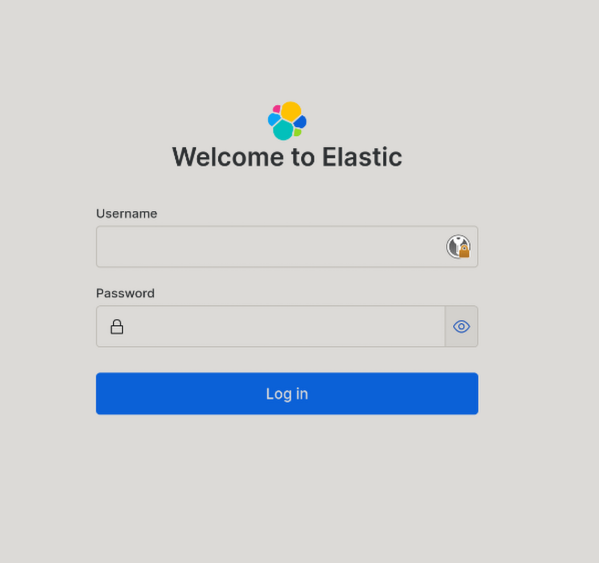
Now you can login with the username elastic and your password generated from the elastic installation earlier. If you have lost this password a new one can be generated with the command:
$ sudo /usr/share/elasticsearch/bin/elasticsearch-reset-password -u elastic
However there are some additional configurations that you should be doing. These are detailed in the following sections.
Enable HTTPS
You are using a password to sign in meaning that it shouldn’t be seen in plain text across the network. We’ll generate a certificate and implement it to setup HTTPS so that we have no more plaintext traffic used for our password.
-
First generate a certificate using elastic search
$ sudo /usr/share/elasticsearch/bin/elasticsearch-certutil csr --name kibana-server --out /etc/kibana/kibana-server.zip -
Next unzip the contents
$ sudo unzip /etc/kibana/kibana-server.zip -d /etc/kibana -
Move the contents to the main folder
text$ sudo mv /etc/kibana/kibana-server/kibana-server.key /etc/kibana $ sudo mv /etc/kibana/kibana-server/kibana-server.csr /etc/kibana$ sudo mv /etc/kibana/kibana-server/kibana-server.key /etc/kibana $ sudo mv /etc/kibana/kibana-server/kibana-server.csr /etc/kibana -
Create the crt file with openssl
text$ sudo openssl req -in /etc/kibana/kibana-server.csr -out /etc/kibana/kibana-server.pem $ sudo openssl x509 -req -in /etc/kibana/kibana-server.pem -signkey /etc/kibana/kibana-server.key -out /etc/kibana/kibana-server.crt$ sudo openssl req -in /etc/kibana/kibana-server.csr -out /etc/kibana/kibana-server.pem $ sudo openssl x509 -req -in /etc/kibana/kibana-server.pem -signkey /etc/kibana/kibana-server.key -out /etc/kibana/kibana-server.crt -
Next edit the
/etc/kibana/kibana.ymlfile and change the linestext#server.ssl.enabled: false #server.ssl.certificate: /path/to/your/server.crt #server.ssl.key: /path/to/your/server.key#server.ssl.enabled: false #server.ssl.certificate: /path/to/your/server.crt #server.ssl.key: /path/to/your/server.keyTo these lines.
textserver.ssl.enabled: true server.ssl.certificate: /etc/kibana/kibana-server.crt server.ssl.key: /etc/kibana/kibana-server.keyserver.ssl.enabled: true server.ssl.certificate: /etc/kibana/kibana-server.crt server.ssl.key: /etc/kibana/kibana-server.key -
Finally restart Kibana
$ sudo systemctl restart kibana
You should now observe that you can only access Kibana via https now and that you will get a warning about your certificate when visiting the webpage for the first time. To fix this you would need to setup your own certificate authority which unfortunately is outside the scope of this guide and to be frank not needed for a small scale home lab.
Fleet Setup
A fleet is used to centrally mange your Kibana integrations. Integrations allow you to create agents to monitor specific logs on hosts. However, you first need to setup your fleet via Kibana.
-
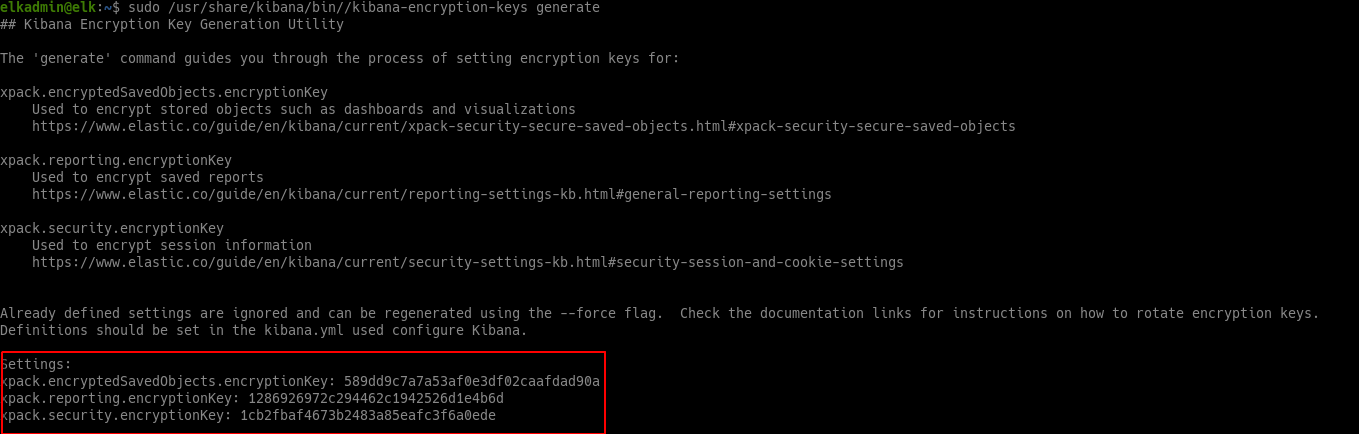
First we need to generate some encryption keys for Kibana saved objects, this will allow us to setup Fleets. Run the following command to generate your encryption keys.
$ sudo /usr/share/kibana/bin/kibana-encryption-keys generate -
You will get an output similar to the following. Note down and copy the values at the bottom.
-
Using a file editor of your choice append the following into the bottom of
/etc/kibana.yml, substituting in your keys.
# This section was added after running "/usr/share/kibana/bin/kibana-encryption-keys generate"

xpack.encryptedSavedObjects.encryptionKey: <YOUR-SAVEDOBJECTS-KEY>
xpack.reporting.encryptionKey: <YOUR-REPORTING-KEY>
xpack.security.encryptionKey: <YOUR-SECURITY-KEY>
# This section was added after running "/usr/share/kibana/bin/kibana-encryption-keys generate"
xpack.encryptedSavedObjects.encryptionKey: <YOUR-SAVEDOBJECTS-KEY>
xpack.reporting.encryptionKey: <YOUR-REPORTING-KEY>
xpack.security.encryptionKey: <YOUR-SECURITY-KEY>-
Now restart Kibana to apply the configurations.
$ sudo systemctl restart kibana -
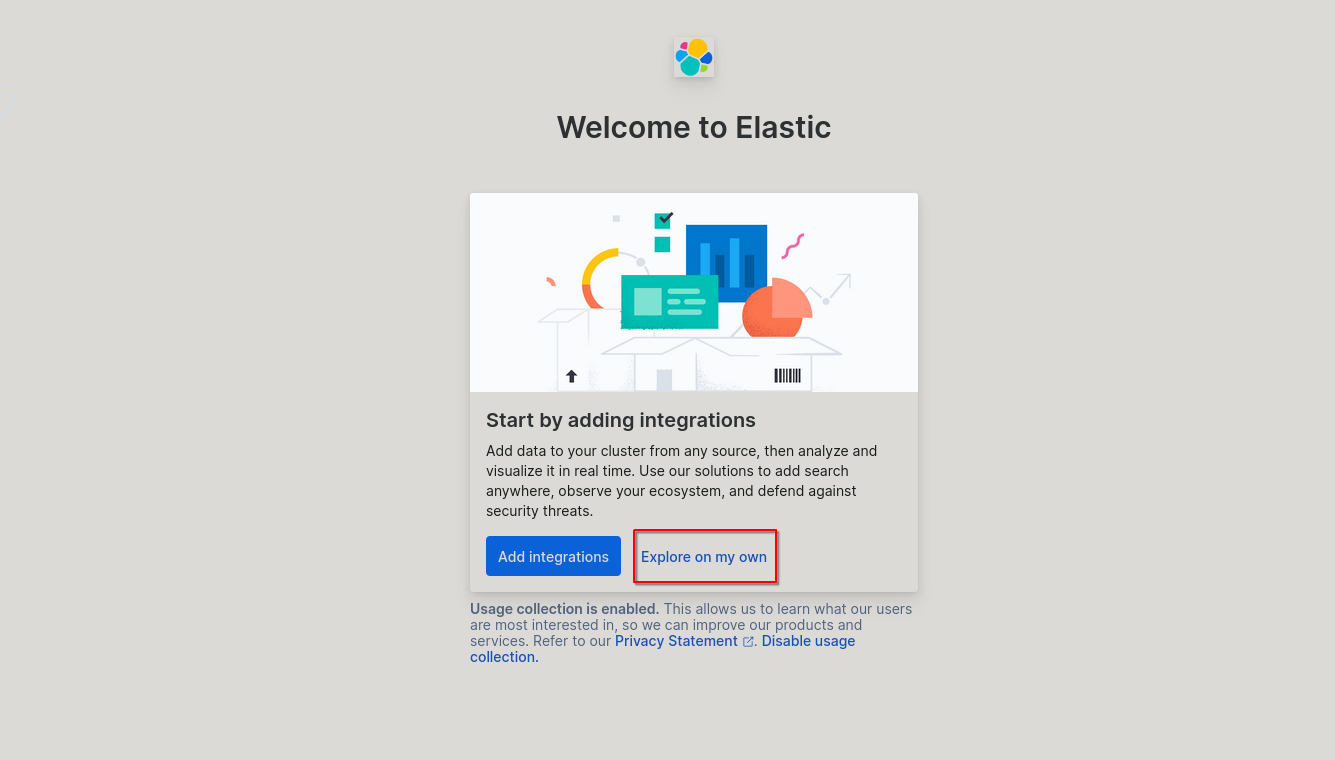
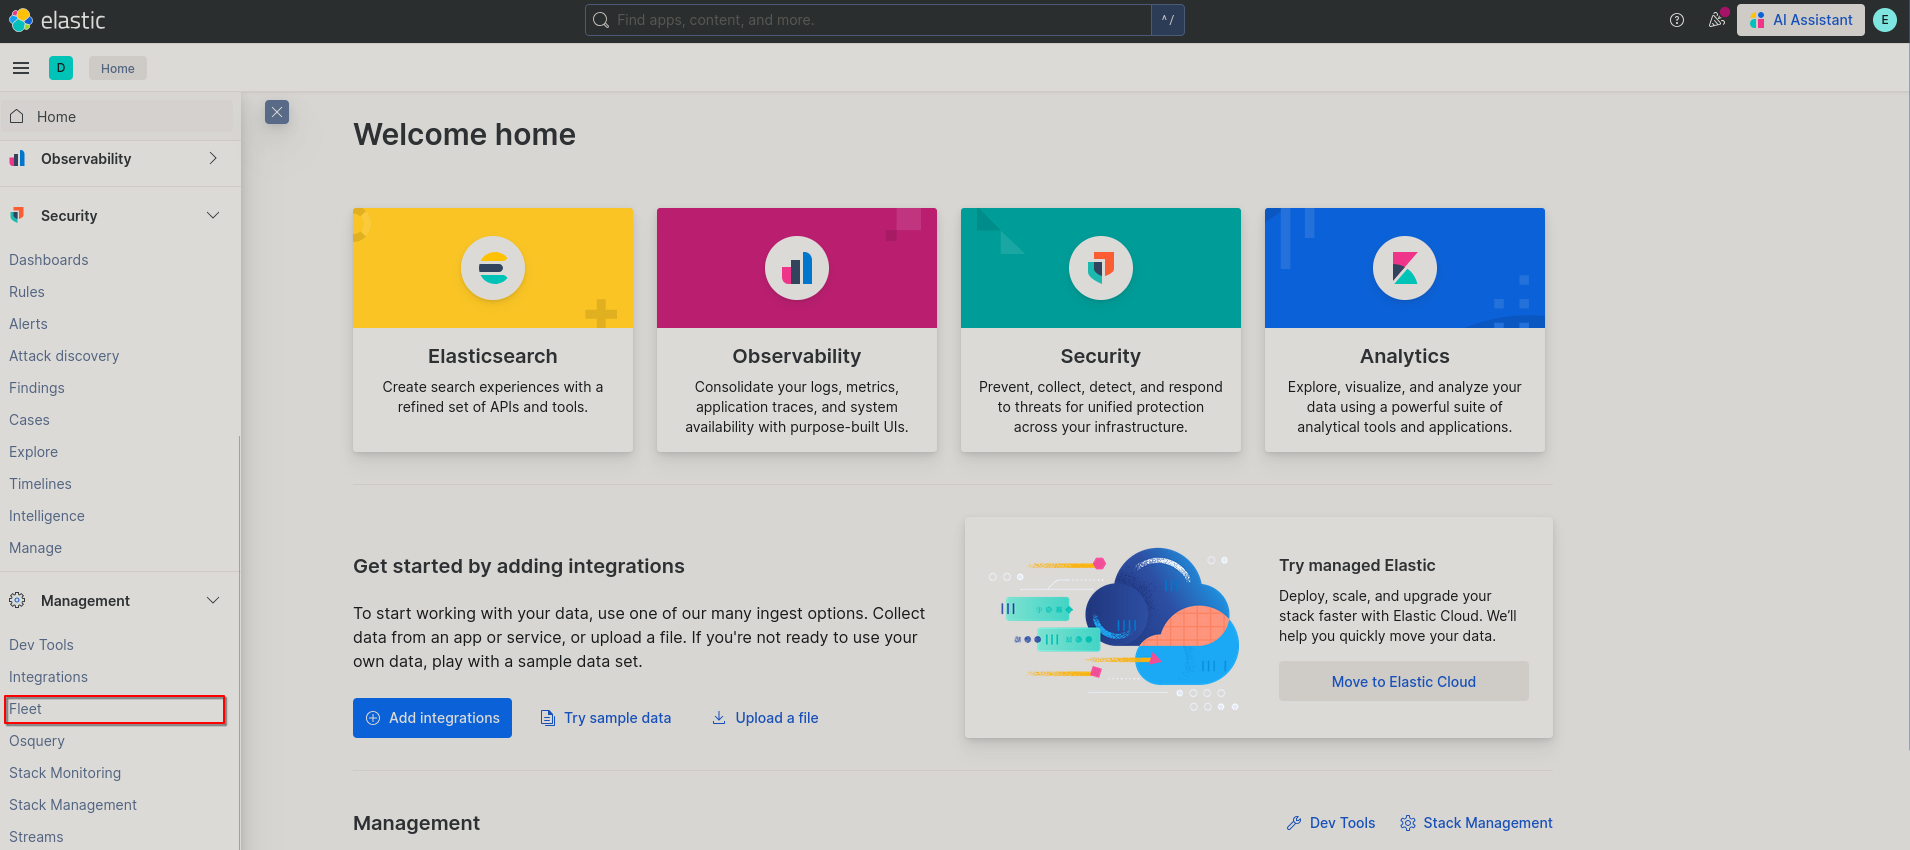
Sign into Kibana, and when prompted to add integrations select “Explore on my own”.
-
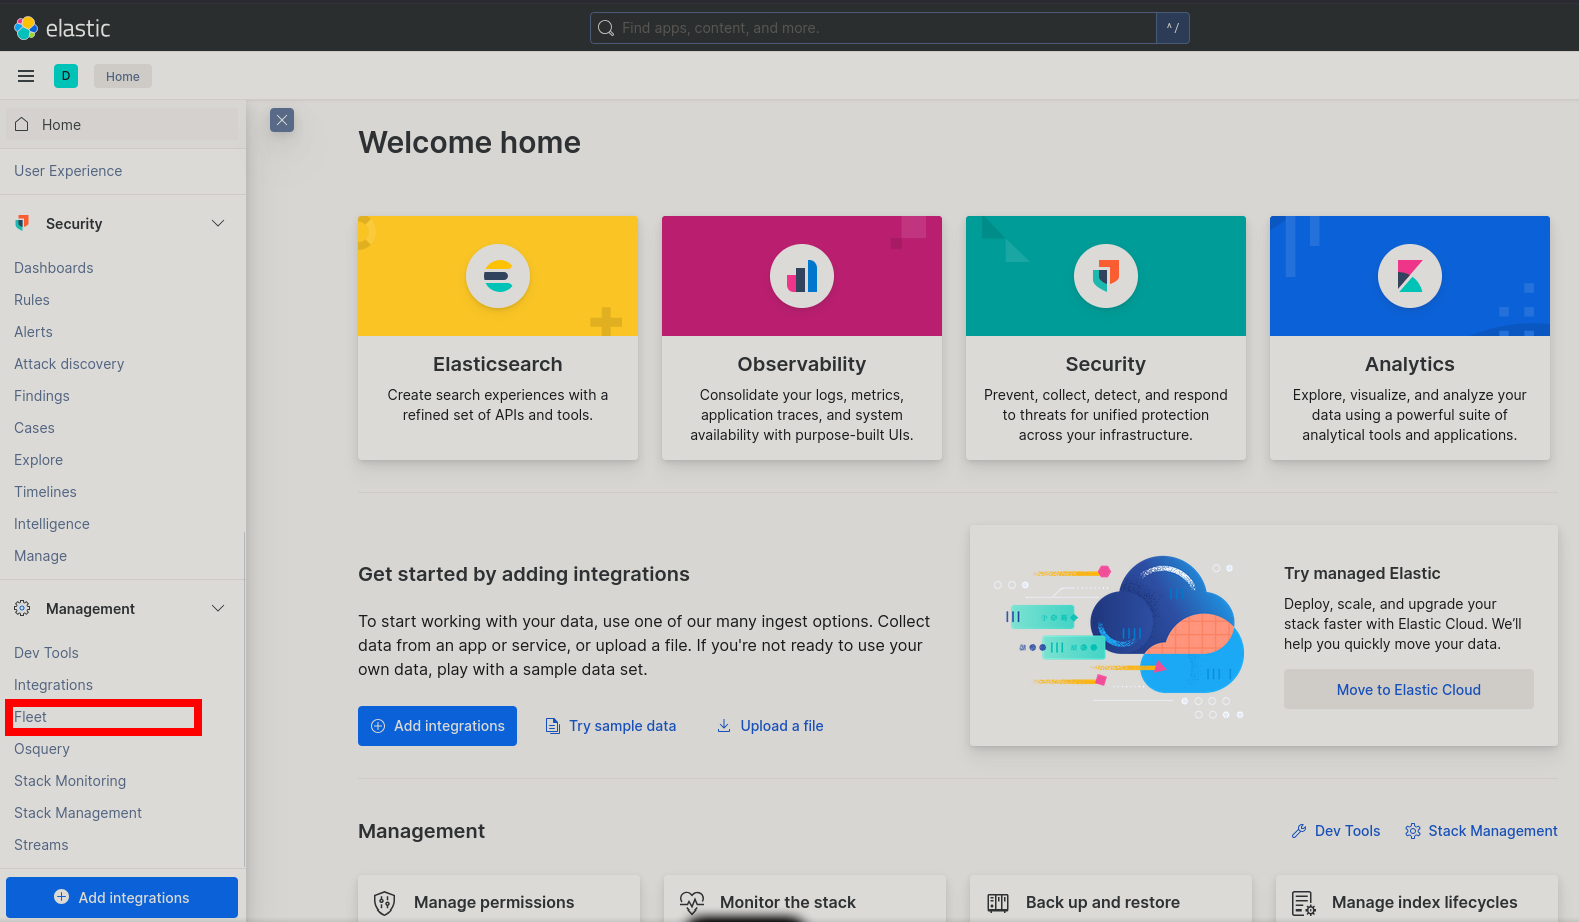
Next click the three bars in the top left and in the drop down go to Management > Fleet.
-
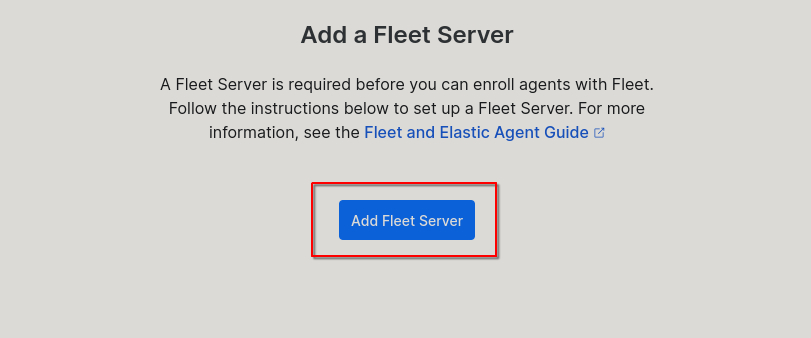
Now click the button in the middle of the screen for Add Fleet Server.
-
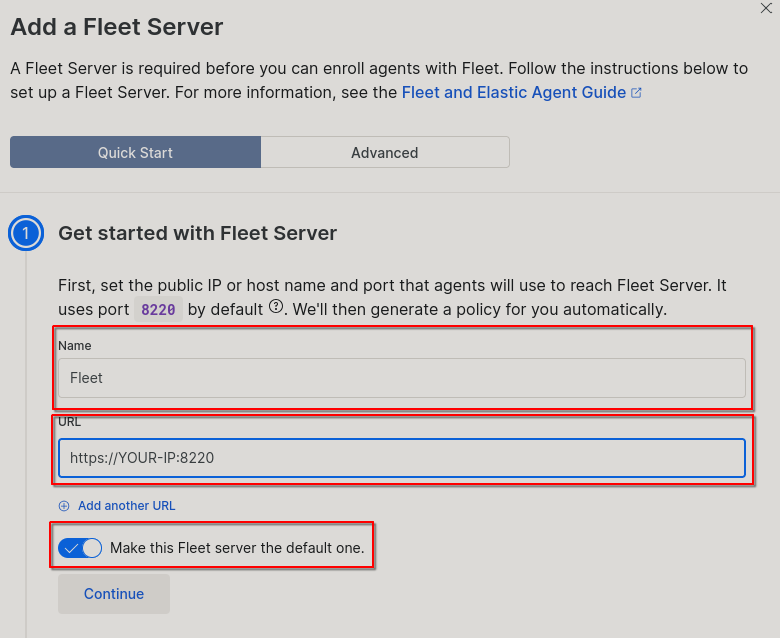
Now Follow the quick start guide, for our purpose we’ll be using the Name “Fleet”, the URL https://YOUR-IP:8220 (using your SIEM’s IP address) and checking the switch to make this fleet server the default one. You may want to modify these as you see fit.
-
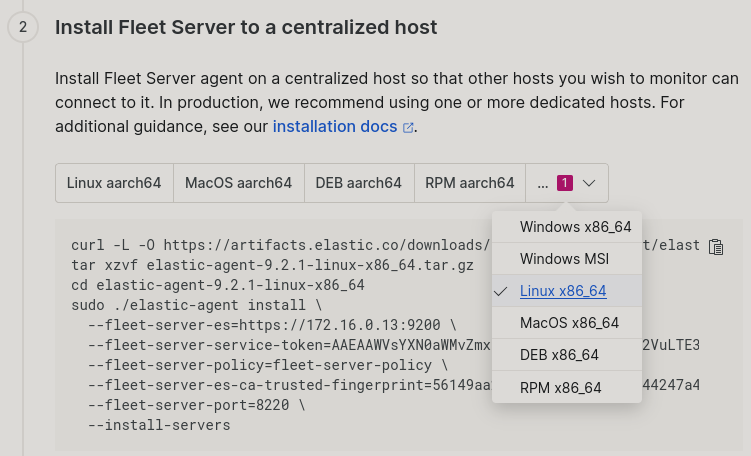
Step 2 of the quick start will provide you with the commands you need to paste into your SIEM host to setup the Fleet on that server. Select your OS and architecture then paste those in to your terminal.
-
After the successful running of those commands you will see the following output in the terminal:
Elastic Agent has been successfully installed. -
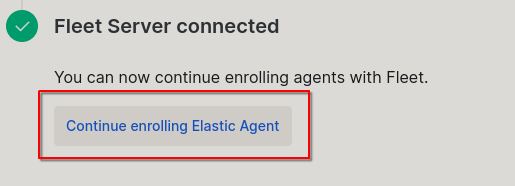
Jump back over to your browser and select the button “Continue enrolling Elastic Agent” in the third step.
-
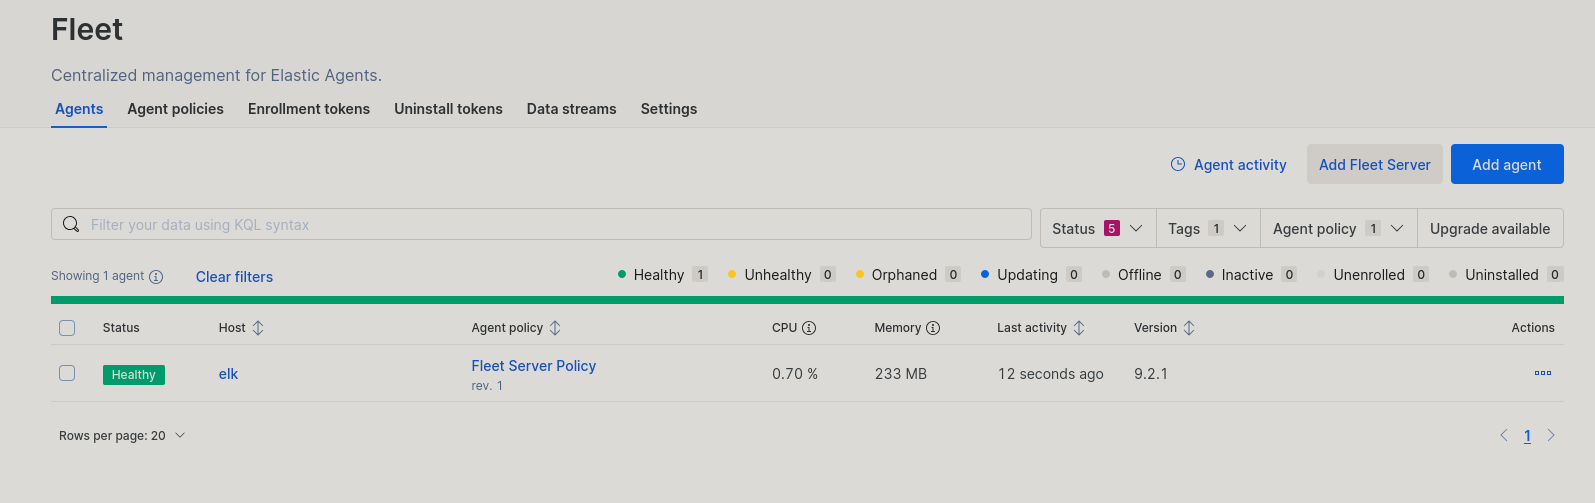
After this you will be prompted to create an agent, click the ‘X’ for now. Then you should see a page like the following showing that you have your Fleet successfully setup!
Connecting an Agent
Why Agents Over Beats
There are two ways to send logs back to elastic search from a host machine. The first way that was integrated was via a beat. Beats were designed to be lightweight data shippers for a specific purpose, such as just getting a heartbeat from the system or collecting specific log files. Because of the nature of beats it is not uncommon to install multiple beats on one host in order to collect all wanted information. However, beats can be hard to manage due to there being no easy way to update them and potentially dealing with multiple beats on one host. Later on elastic introduced agents which provide the same functionality as many beats in one binary and are more easily manageable. Agents are not an exact one to one with beats, but are far easier to use, deploy, and manage. In addition, elastic is pushing users to swap over to agents wherever applicable. Therefore, we will only be going over the installation of Agents in this guide. If you are still curious about the differences, you can take a look at the official elastic documentation here
What are Integrations
You may remember that we were prompted to setup an integration when we first logged into Kibana. To understand what an integration is we first need to know about Policies. Policies are used to create agents that collecting system logs or information under specific rules. As one host cannot have multiple agents sometimes the use of differently policies for different use cases is needed. For each policy you can setup many different integrations, which are the things that dictate what information the agents should be collecting. If an agent is created by a policy with one or more incompatible integrations (ex. Linux host has an agent with windows integrations) then the incompatible integration(s) will be ignored and only applicable information will be collected.
TLDR
Policy: Creates agents that collect information from the host under specific rules via one or more integrations.
Agent: A service on a host that sends logs back to Elasticsearch.
Integration: A set of rules an agent will follow.
Creating a Security Policy
Here we’ll show how to create a policy to be used for collecting logs that we can alert on, as well as provide features for hosts that you would want in a typical SOC.
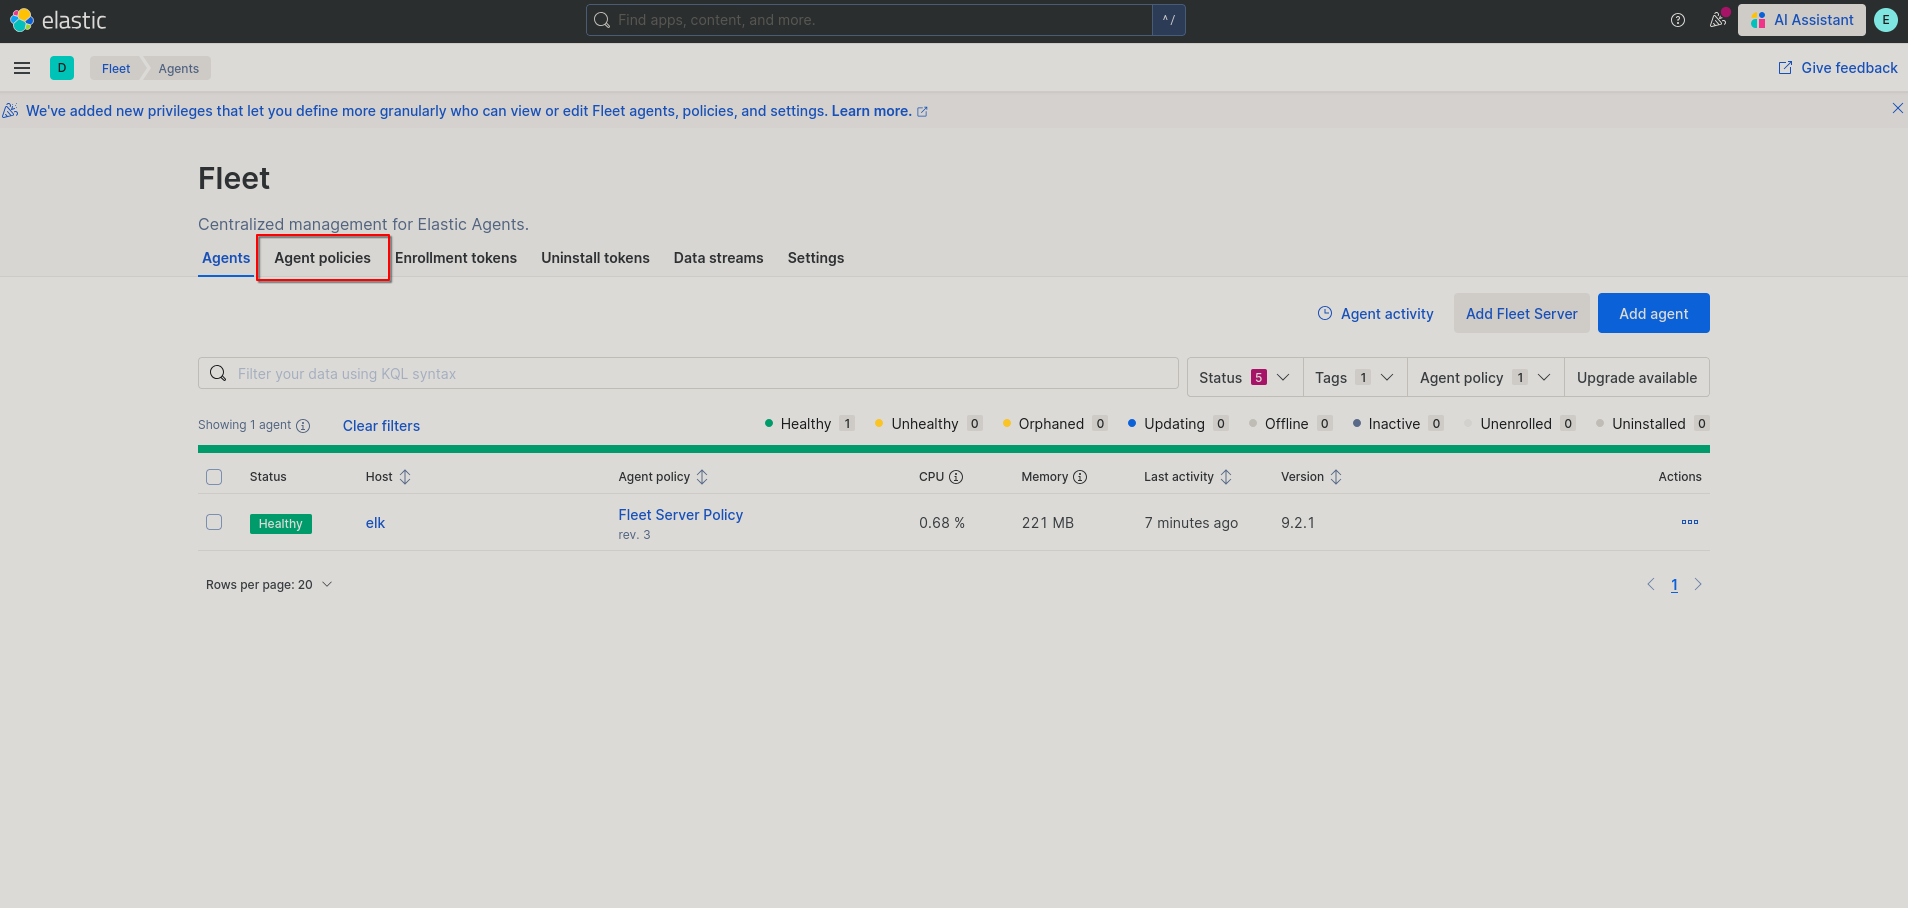
- Go to Fleet page. From the main menu this can be accessed from the three bars in the top left and clicking on Management > Fleet.
- Next click on the “Agent policies” tab from the Fleet page.
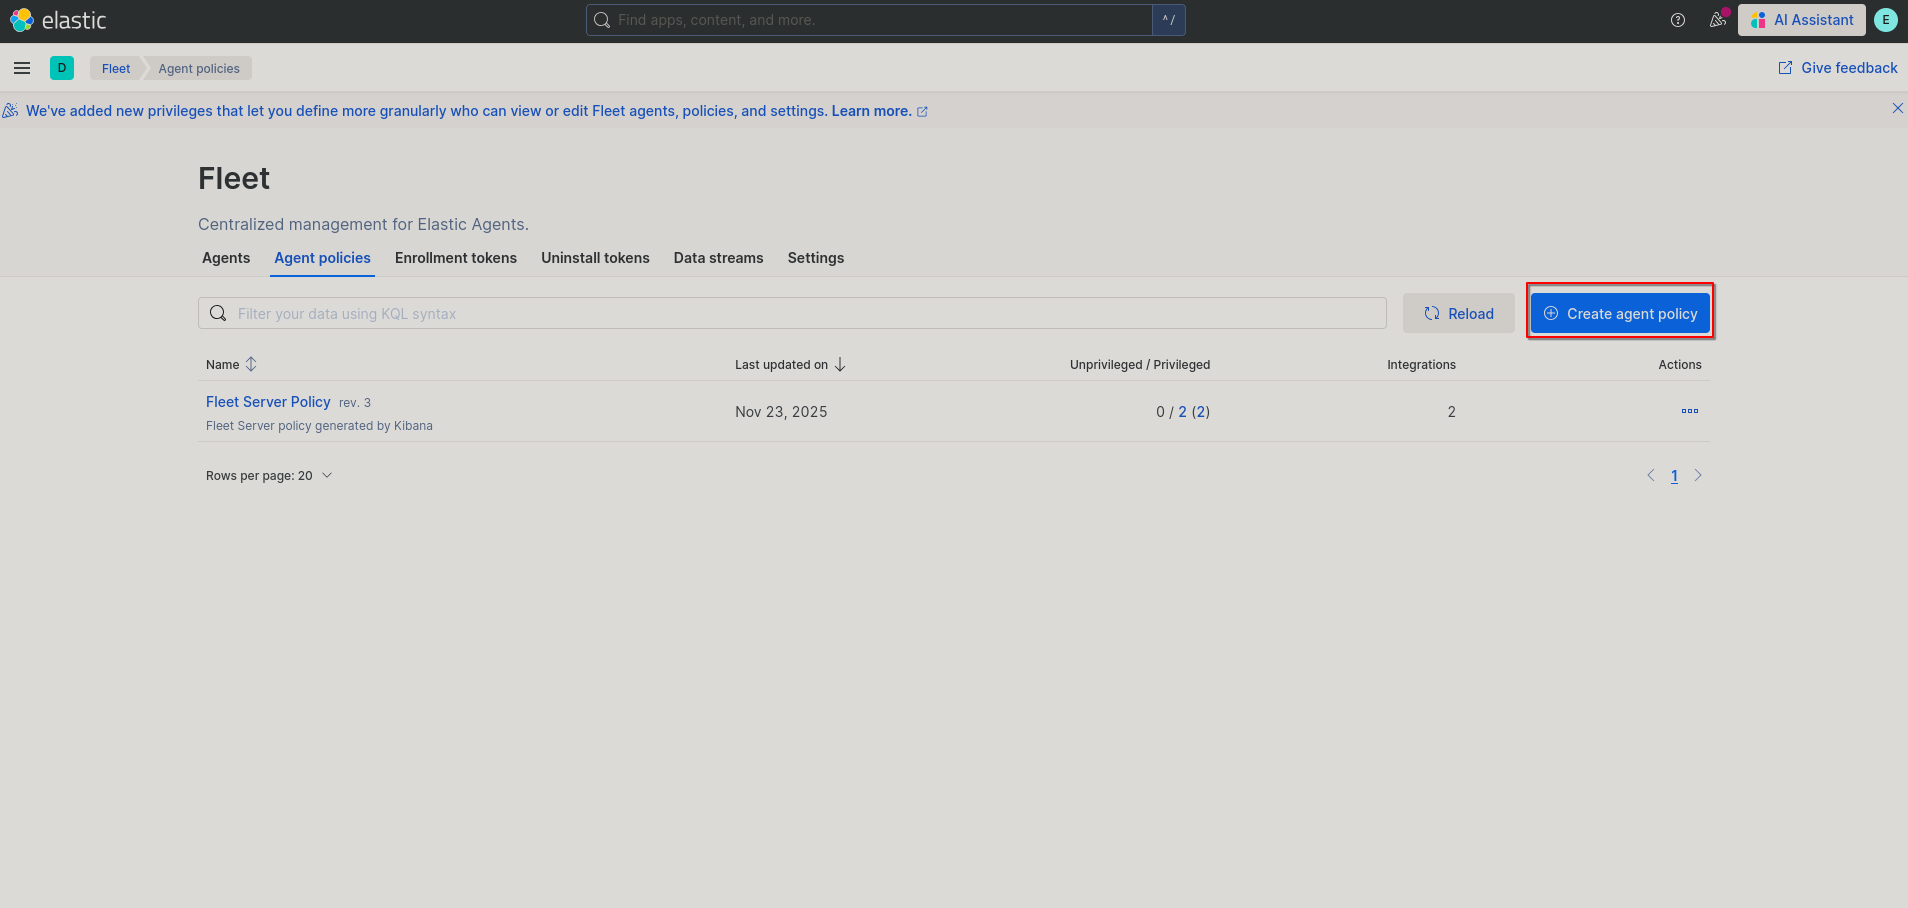
- Next click on “Create agent policy”.
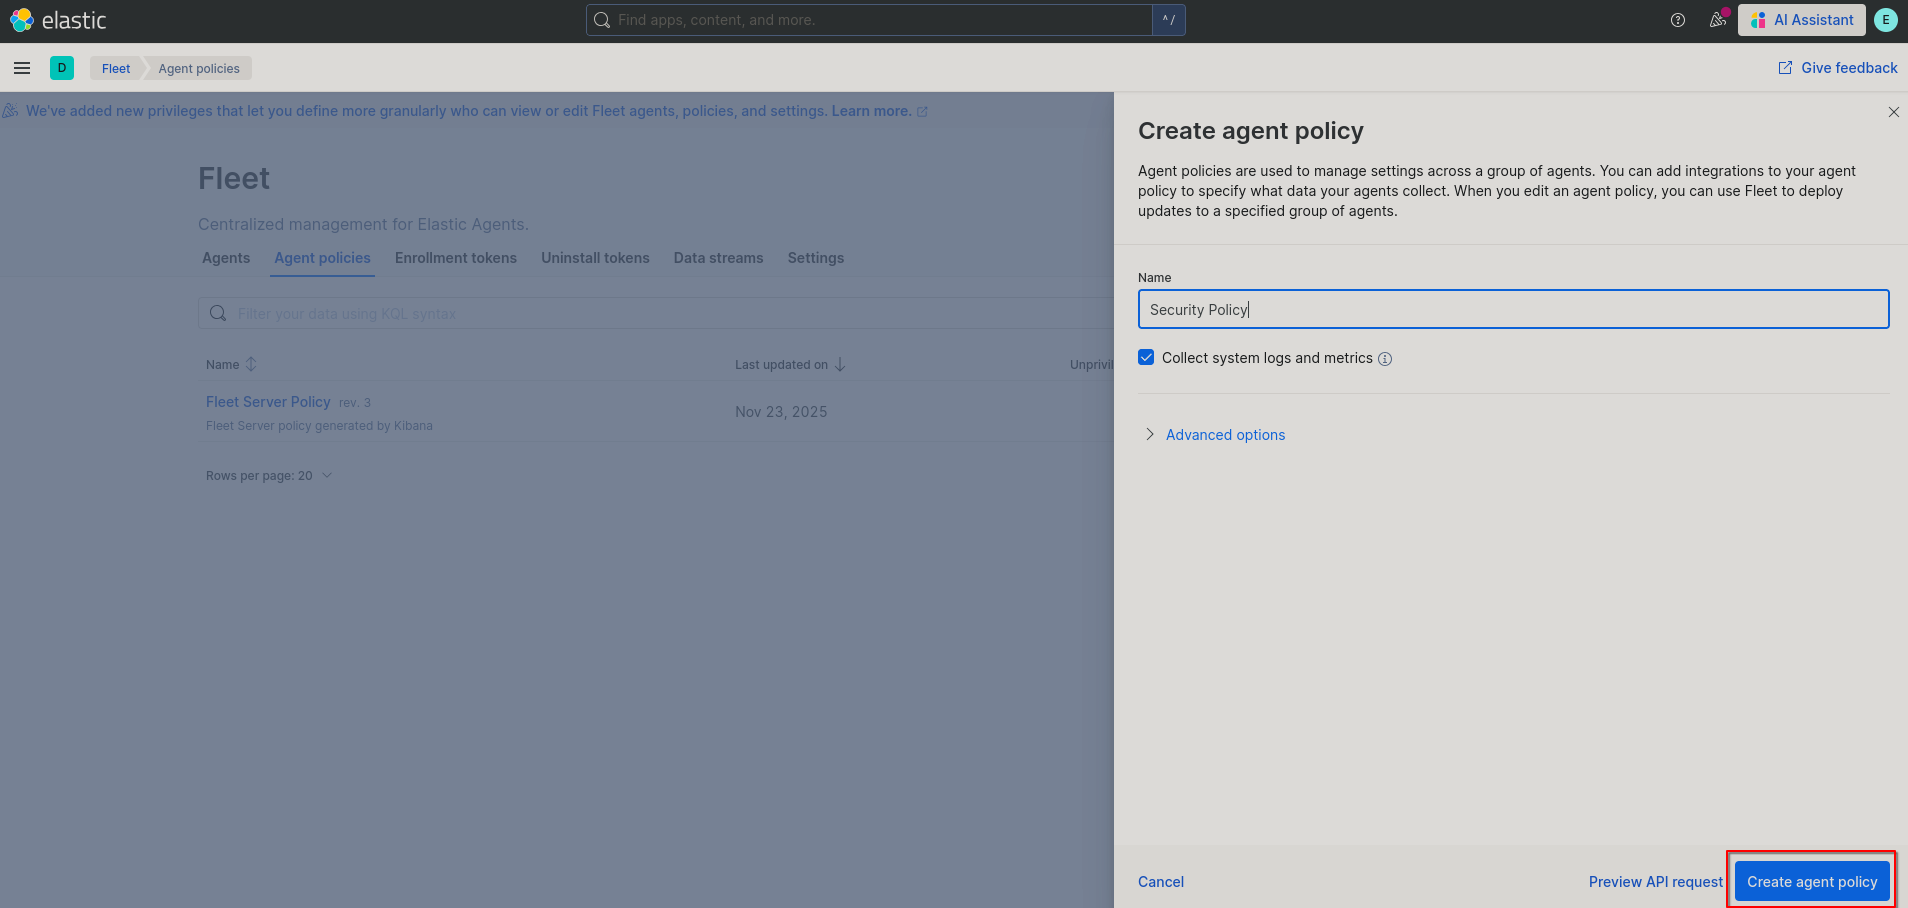
- Choose a meaningful name like “Security Policy” and click on “Create agent policy”.
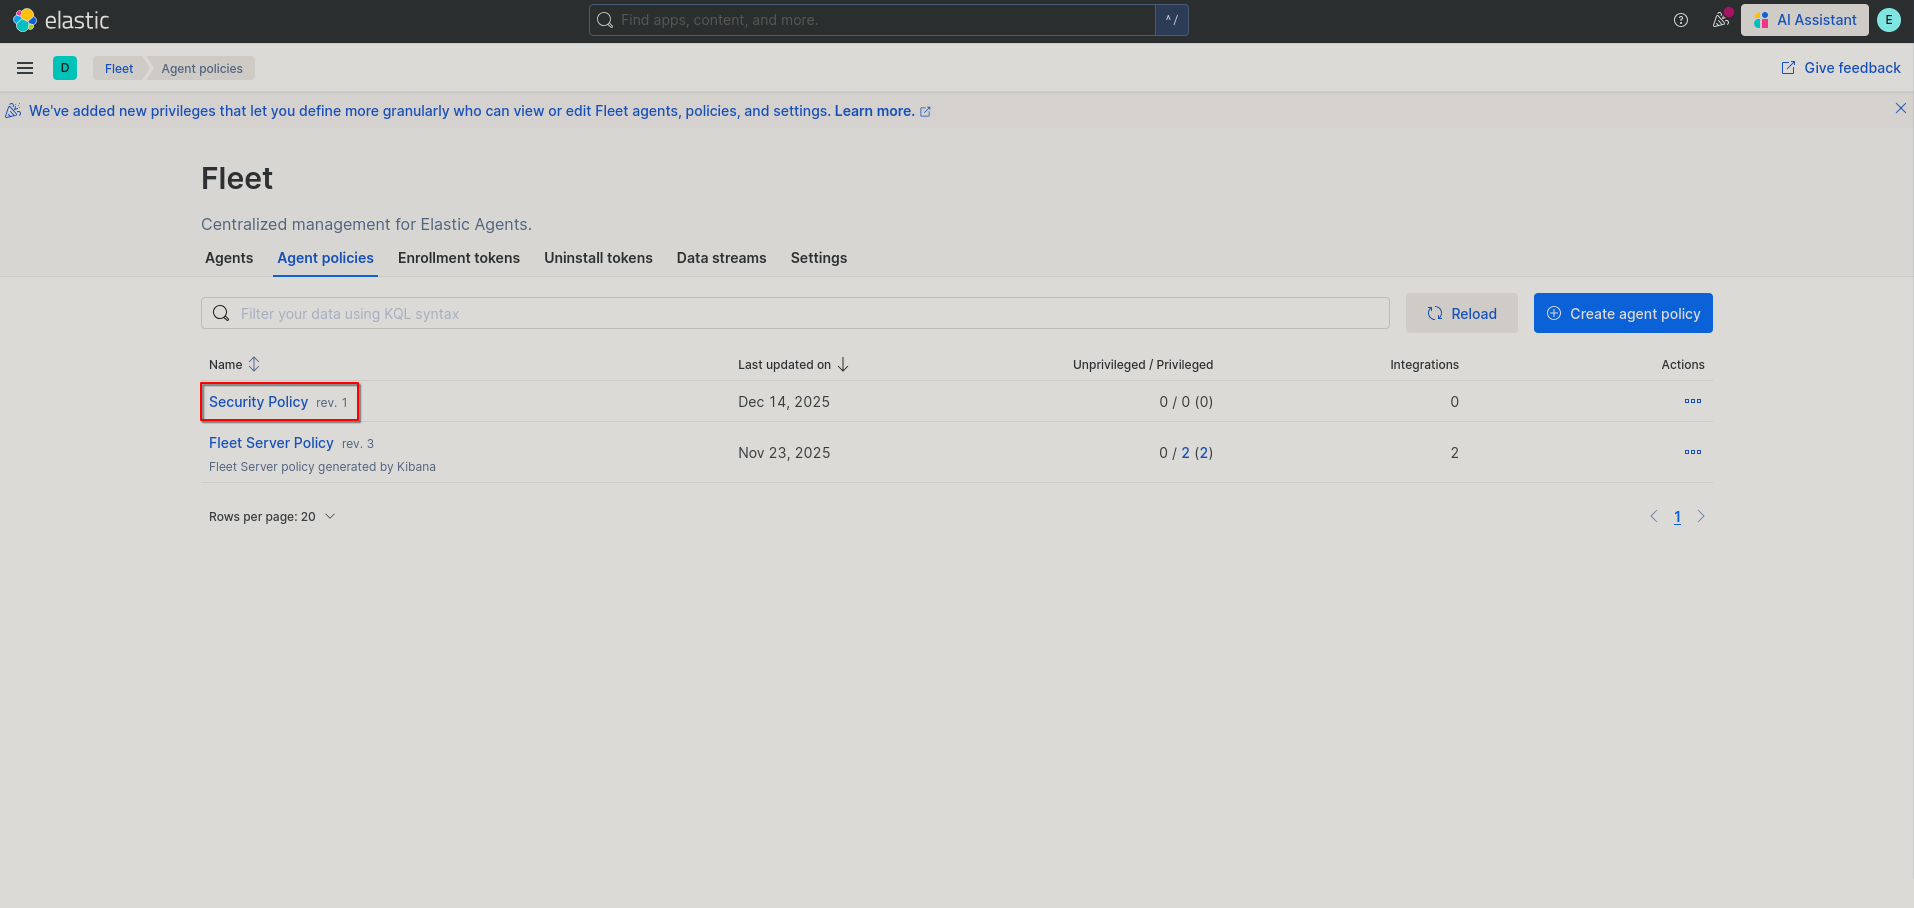
- Now click on your newly created policy.
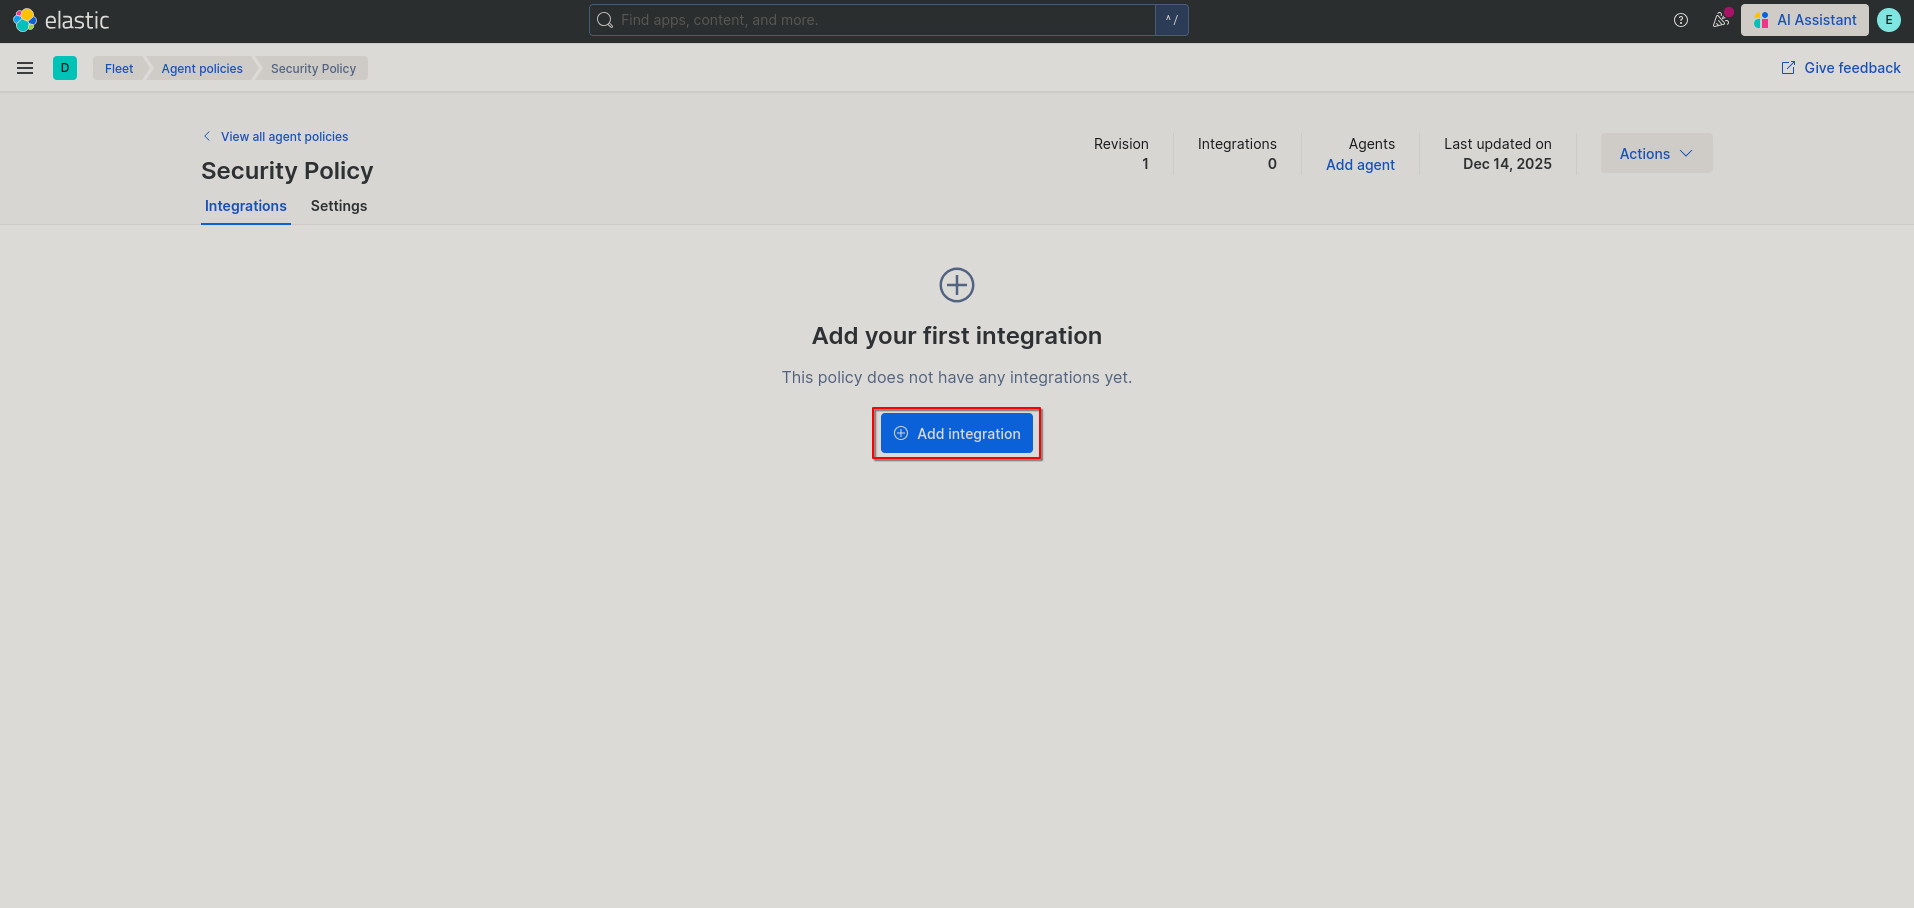
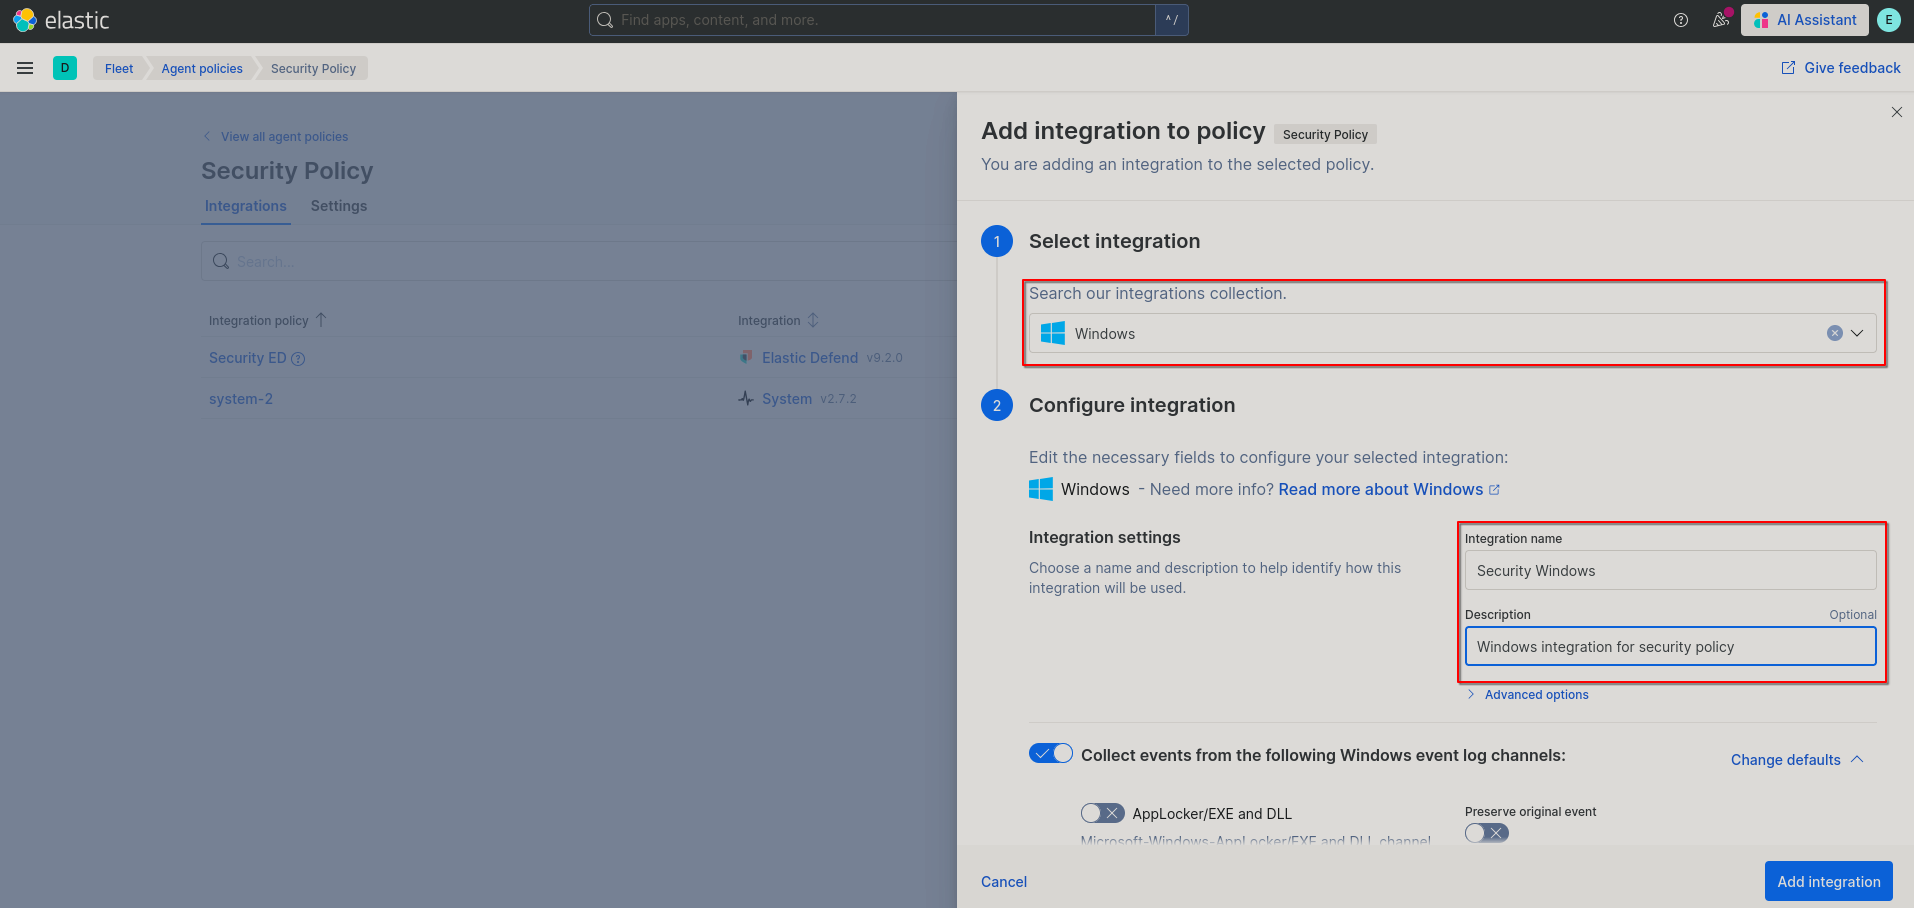
- Click on “Add integration” in the middle of the page.
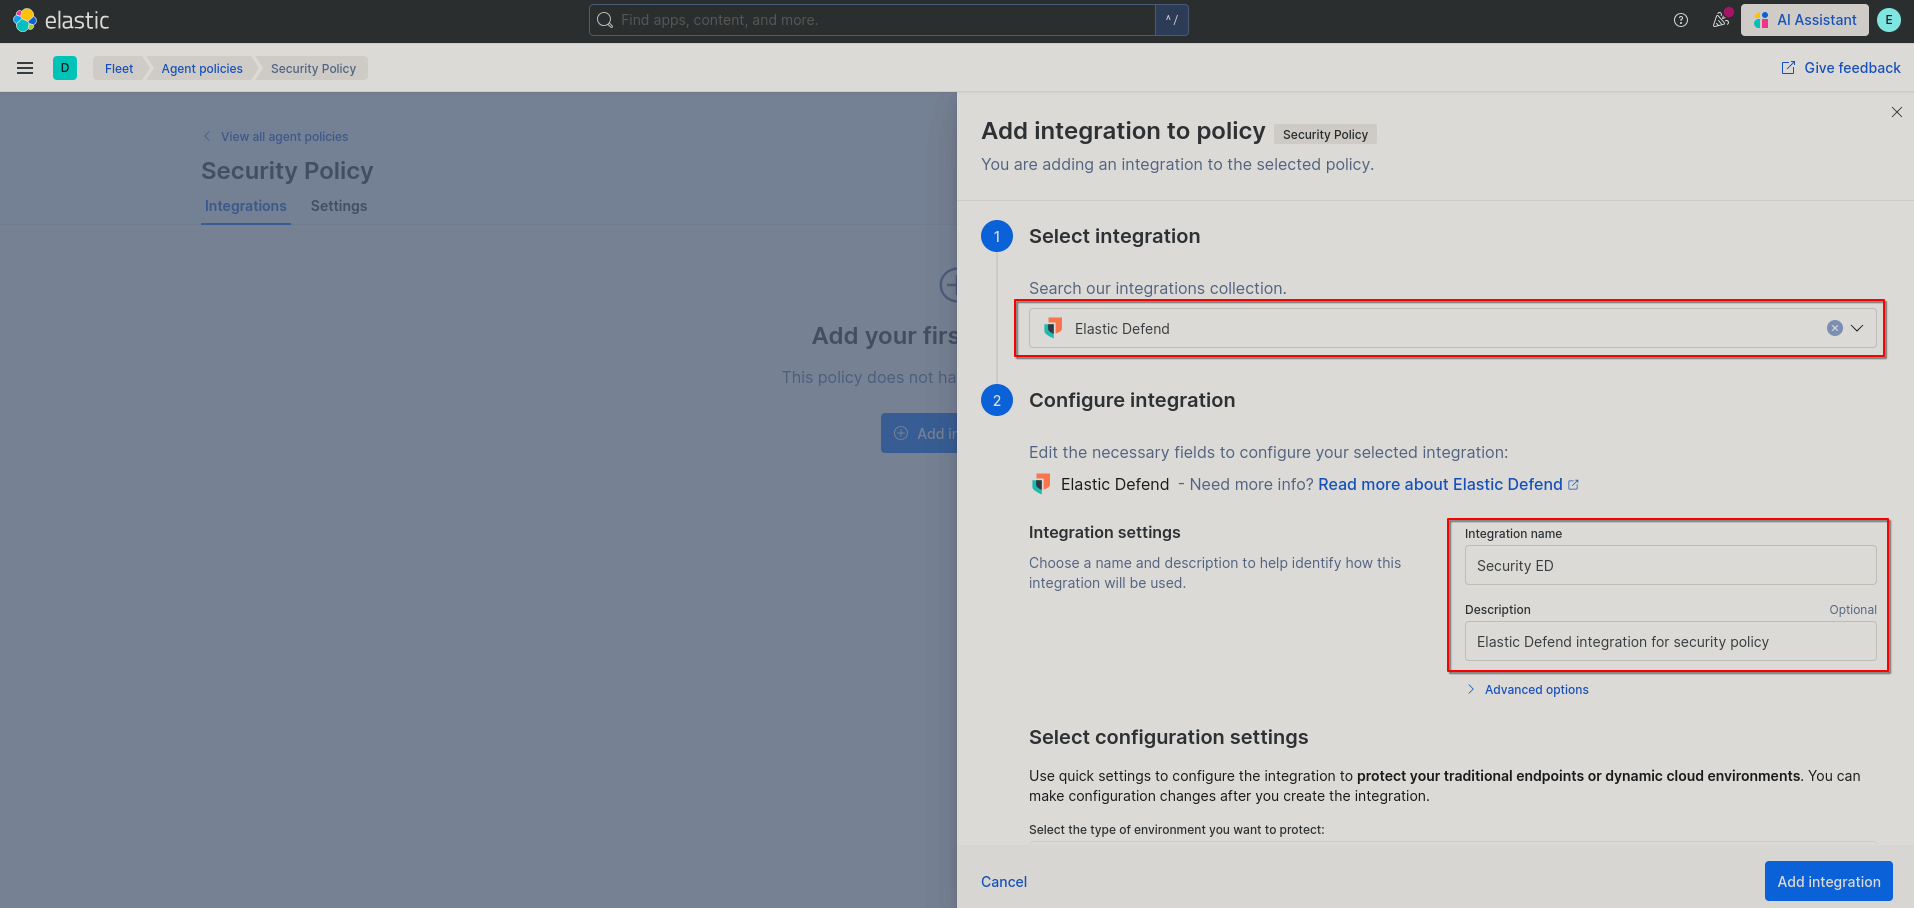
- In the pop up menu search for and select “Elastic Defend”, give your integration a meaningful name, optionally give your integration a description, and for your configuration settings you can leave the environment type as “Traditional Endpoints” and leave “Complete EDR” as the chosen setting. Then click “Add integration”.

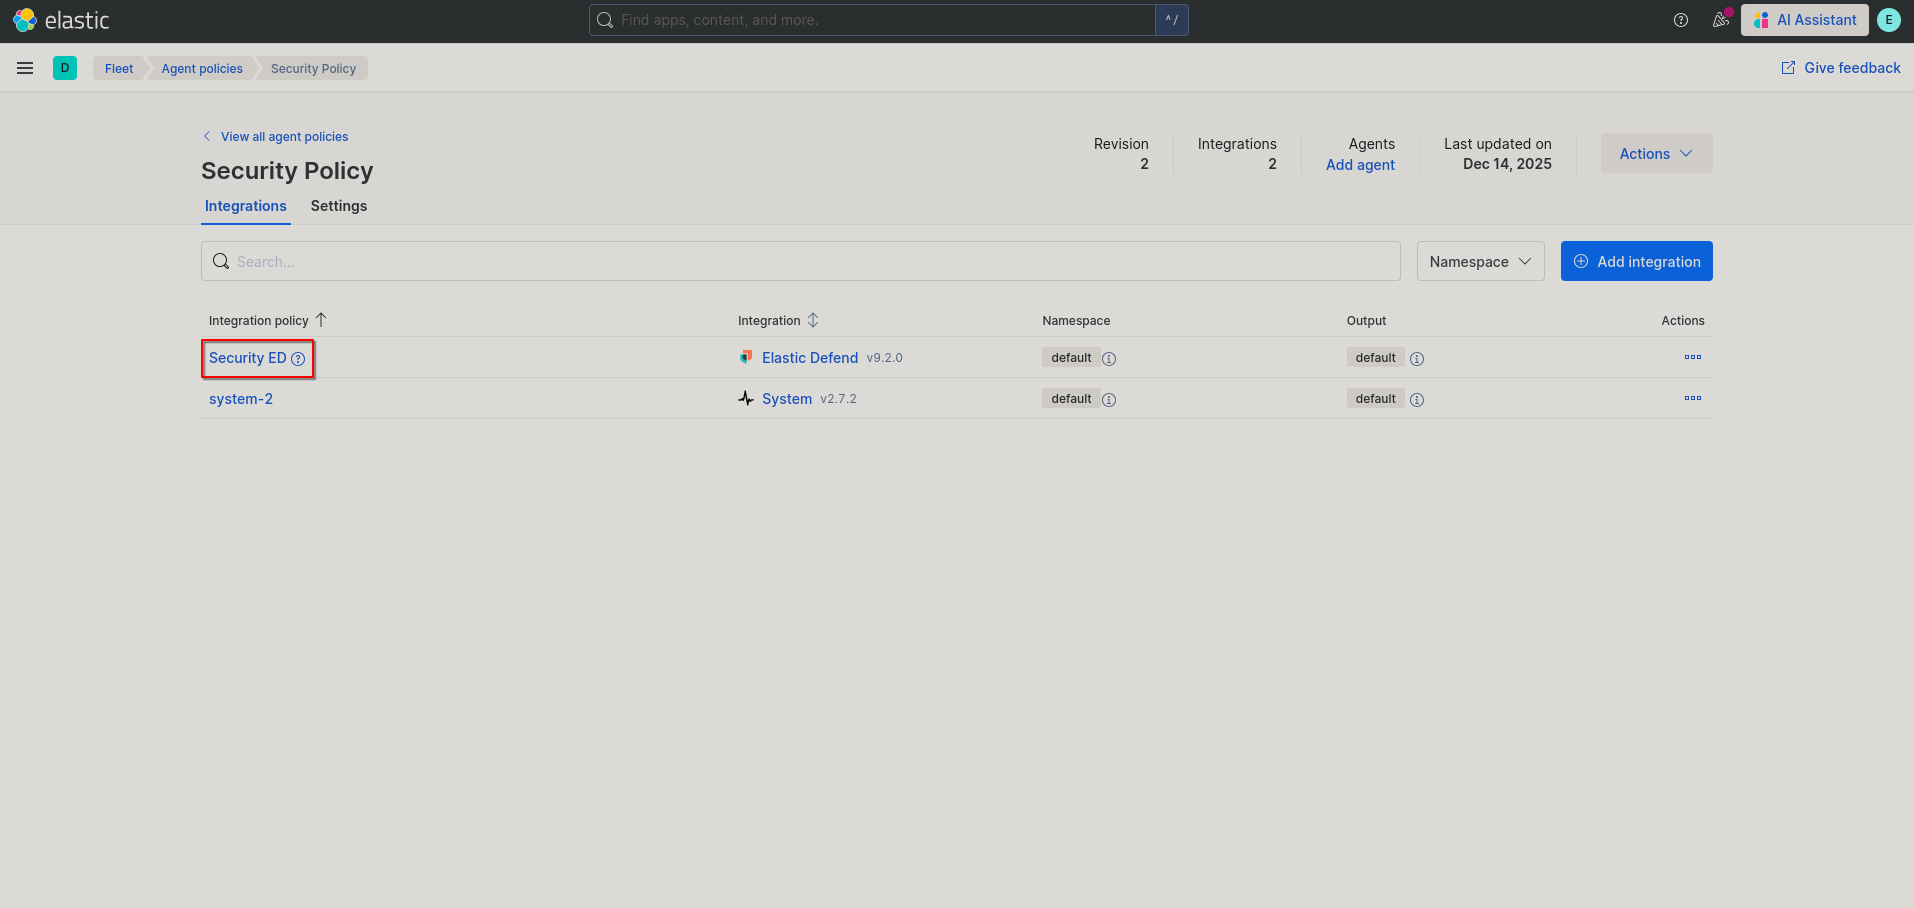
- You’ll now be back at your policy page, click on your newly created Elastic Defend integration (You’ll also see a system integration that exists to collect logs from linux hosts).
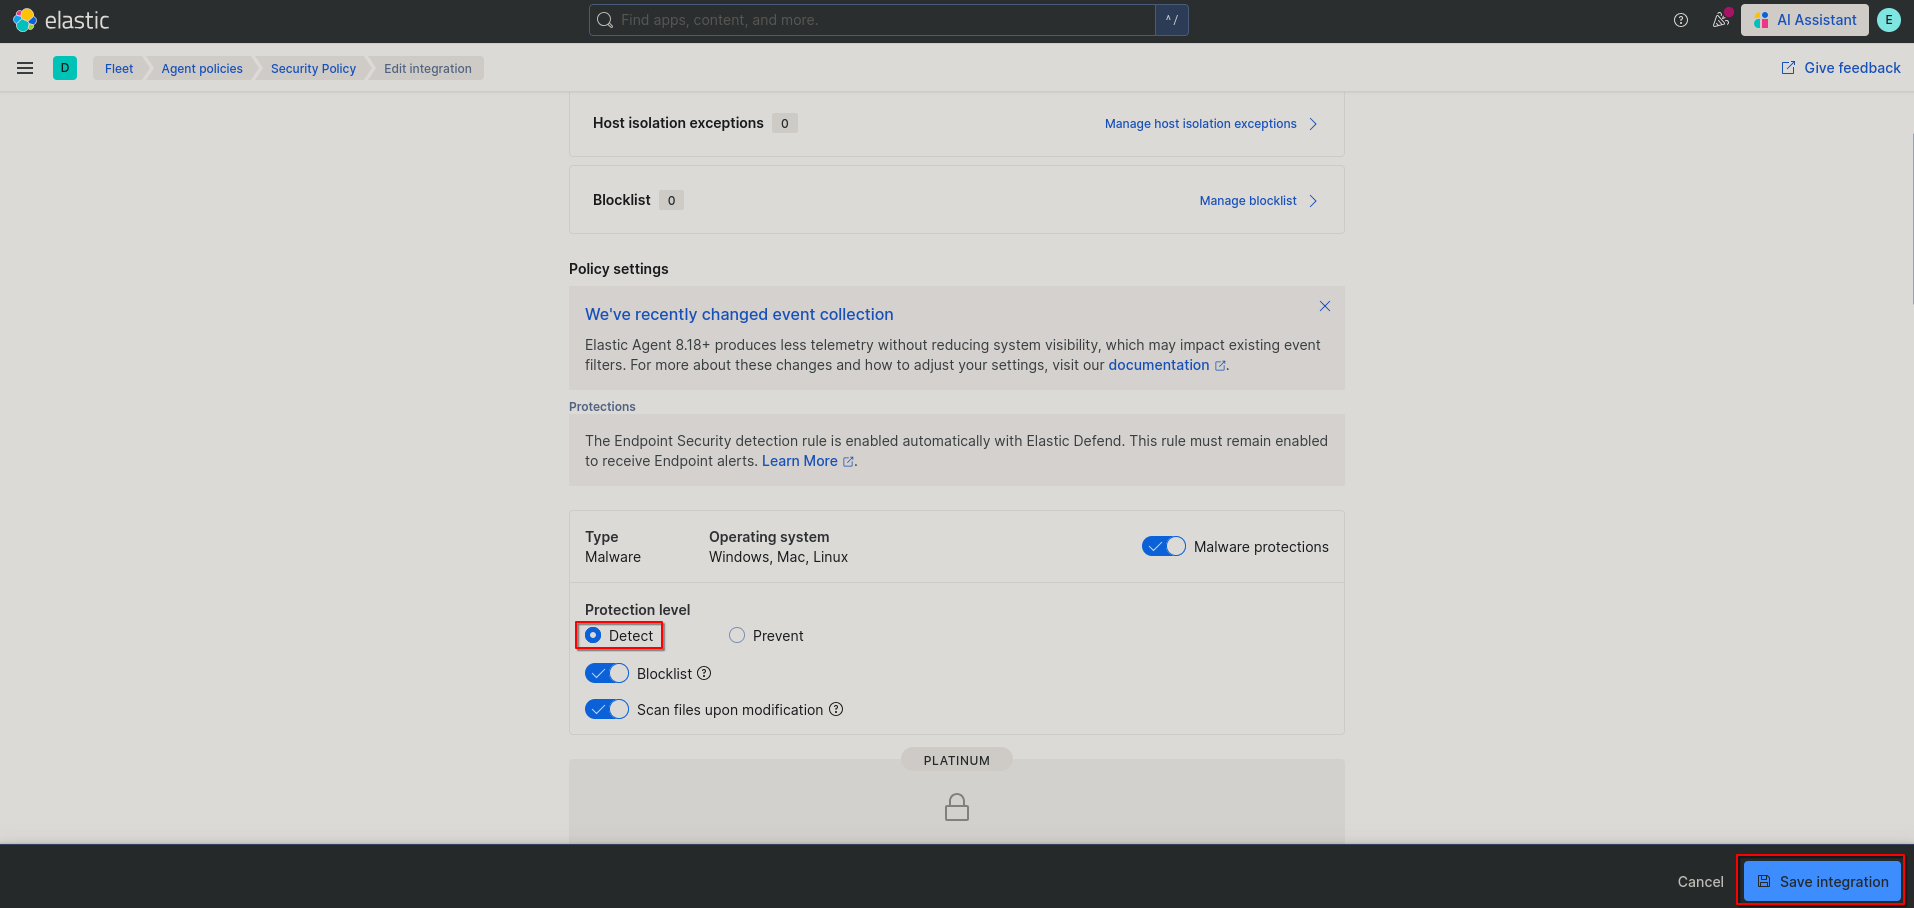
- In your integration settings, scroll down to “Protection level” and switch it to “Detect”. You can experiment with this later, however when starting out you should leave this on detect as to not cause unintended issues. Then select “Save integration”.
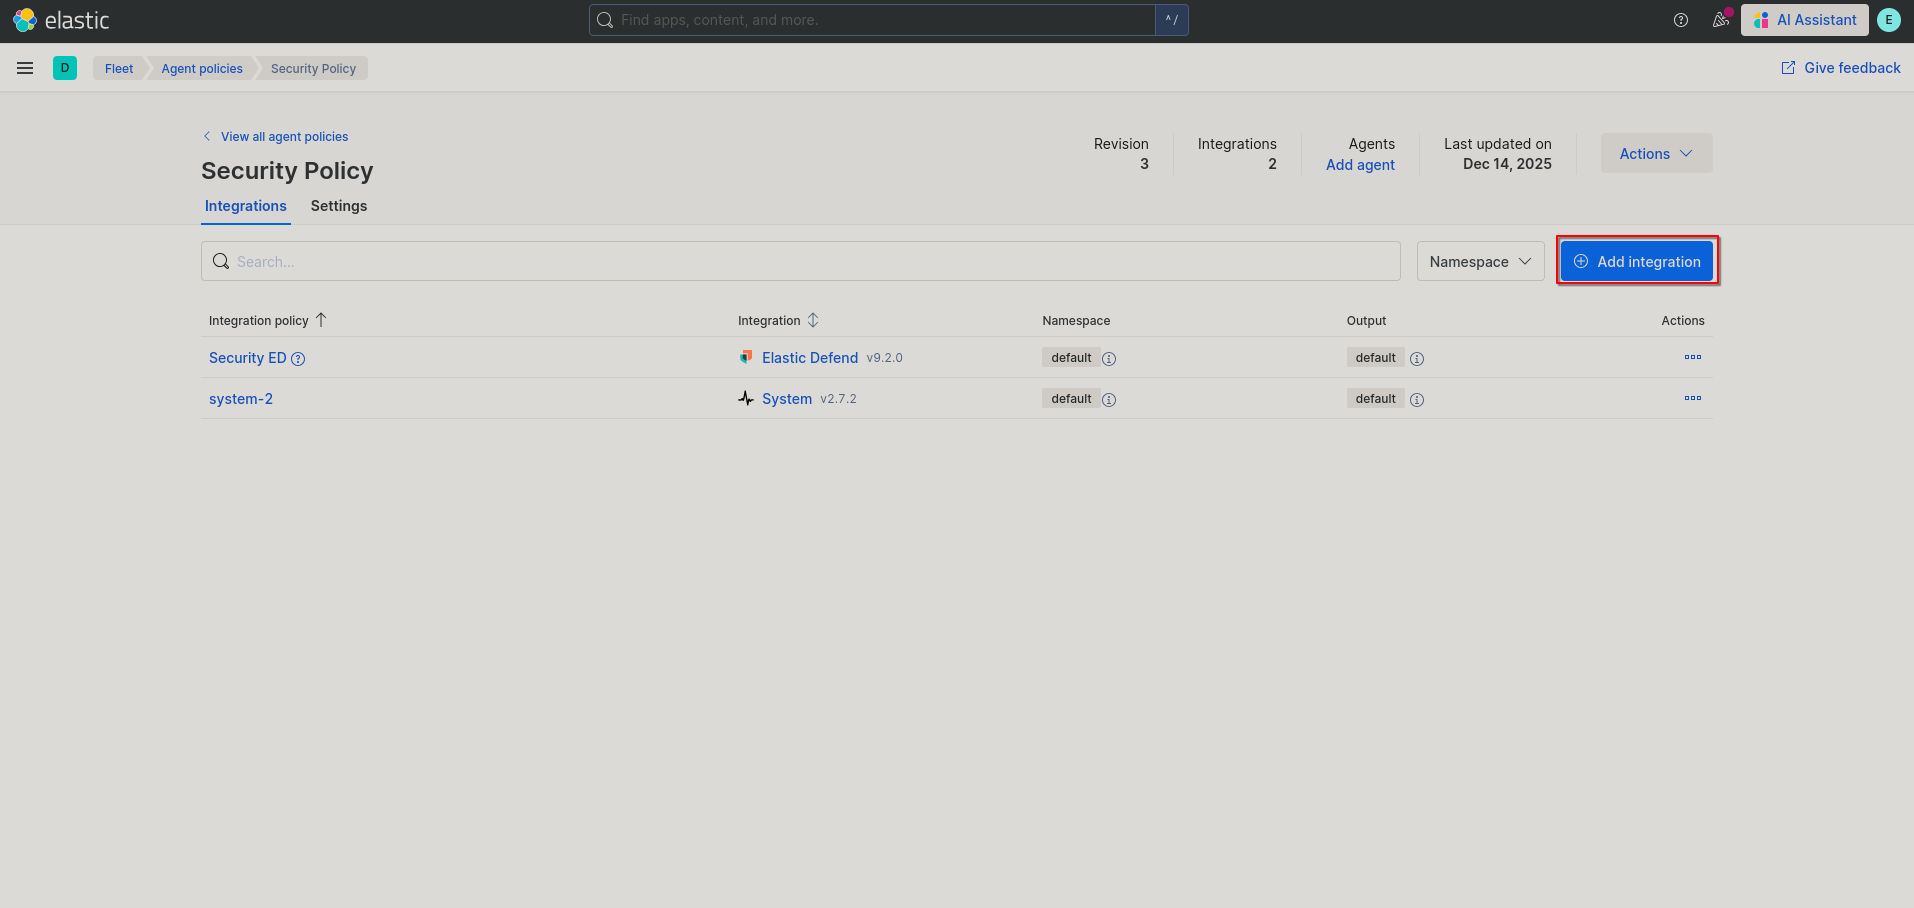
- You’ll now be brought back to your policy page, if you don’t plan on using any windows agents then you can skip these next steps. If you do, then click on “Add integration” again.
- Search for the integration “Windows” and give your integration a meaningful name and description. Then go into “Collect events from the following Windows event log channels:”, then modify this to as you see fit. The more boxes you check the more logs your SIEM will have to process. However it is highly recommended that you install Sysmon on your host and check the “Sysmon Operational” box. Personally I also like to check the “Preserve original event” for the Sysmon logs as well. You can find the Sysmon download here and I recommend to start out with one of the community Sysmon config files such as the one from SwiftOnSecurity found here. Once done click on “Add integration”.
 You’ll now be back on the policy page with your policy setup. Now we can worry about adding agents from this policy to our hosts.
Adding agents
With our newly setup policy, adding agents will be pretty straight forward. However, there are some slight differences when installing an agent on Windows or on Linux. They will be observed below.
- Navigate to the policy page for the policy that you want to create an agent on. Click on “Actions” > “Add agent”
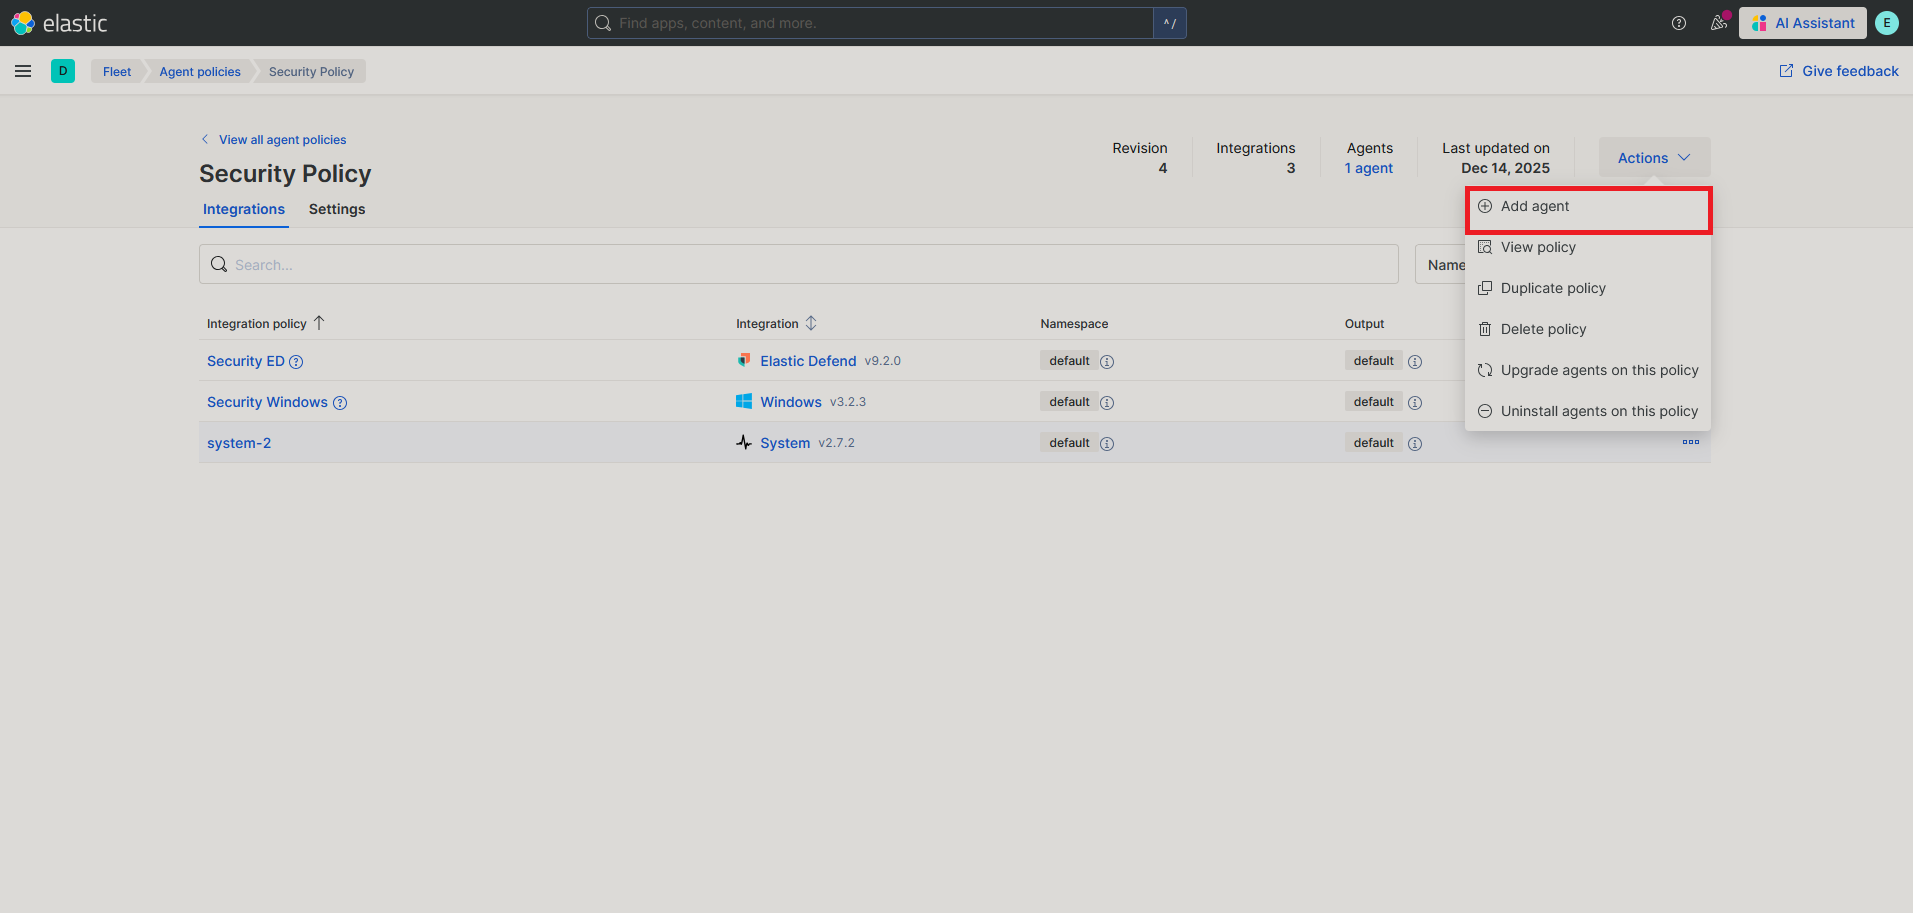
- This will bring up a drop down menu, we can skip over step one as we only have on enrollment token and leave the option “Enroll in Fleet” selected in step 2. In step 3, you are prompted to select your OS and architecture/installation method. Below, we’ll go over the differences for Linux Vs. Windows.
Linux
-
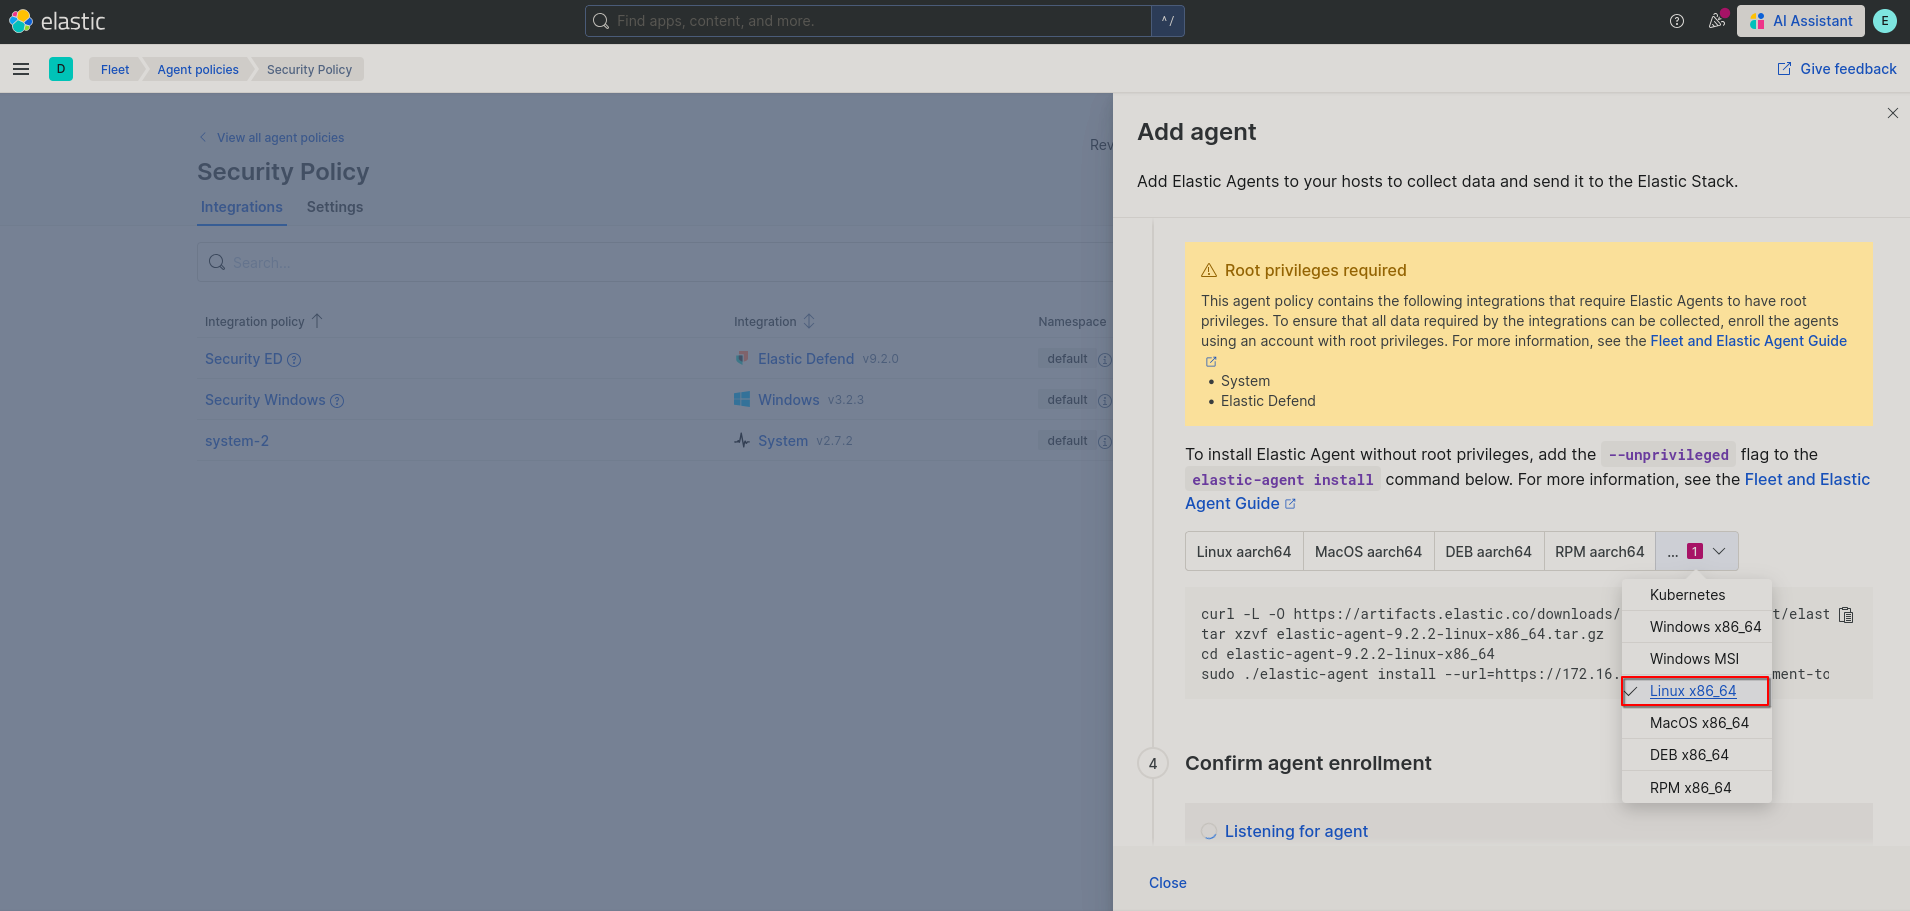
Select your OS architecture. This will provide the code you need to past into your host’s terminal.
-
Copy all but the last line of the provided commands and paste them into a Linux host that you want to collect logs from.

-
Now grab the final line that would install the elastic agent. Append
--insecureto the end of it. This is necessary as we are using our own TLS certificates without a CA. After appending insecure, run the command and follow the directions provided. Your command should look something like the following:$ sudo ./elastic-agent install --url=https://<YOUR-SIEM-IP>:8220 --enrollment-token=RHVkZSwgZ28gZ2V0IHlvdXIgb3duIGNlcnRpZmljYXRlIHRva2VuISA+Oig= -- insecure -
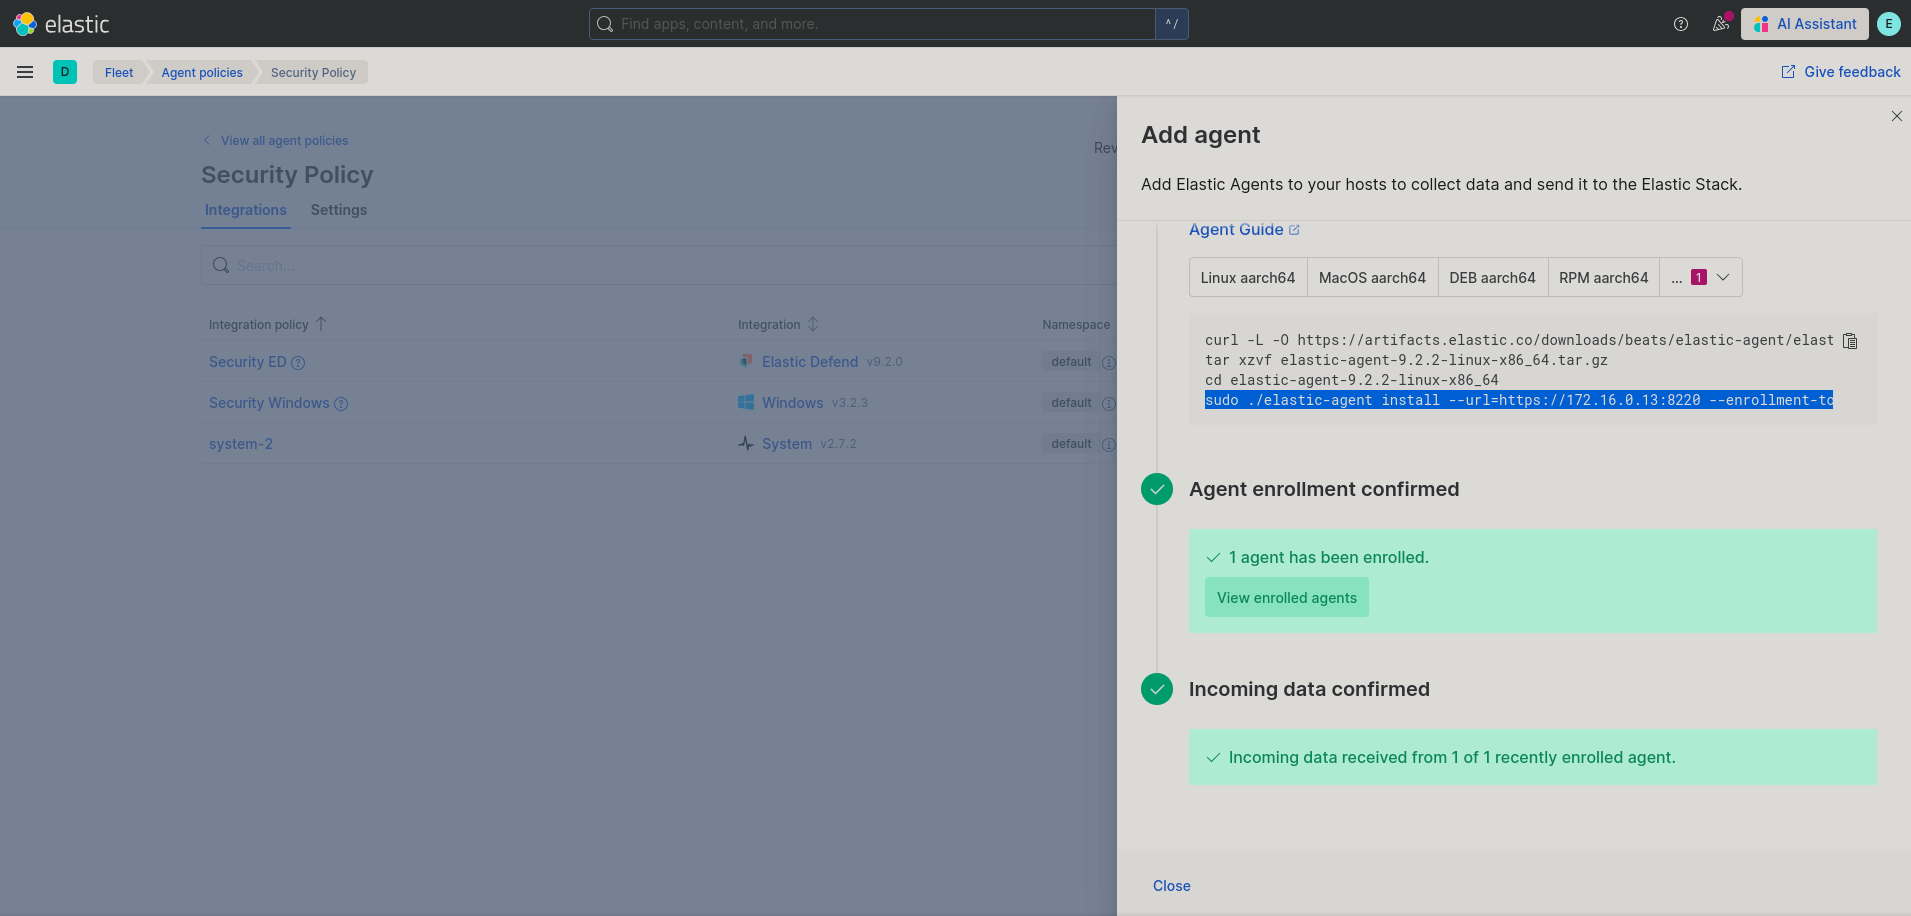
After completing this, back in your browser you’ll see the following, indicating that you have successfully installed the agent.
Windows
-
Select your OS architecture. This will provide the code you need to past into your host’s terminal.
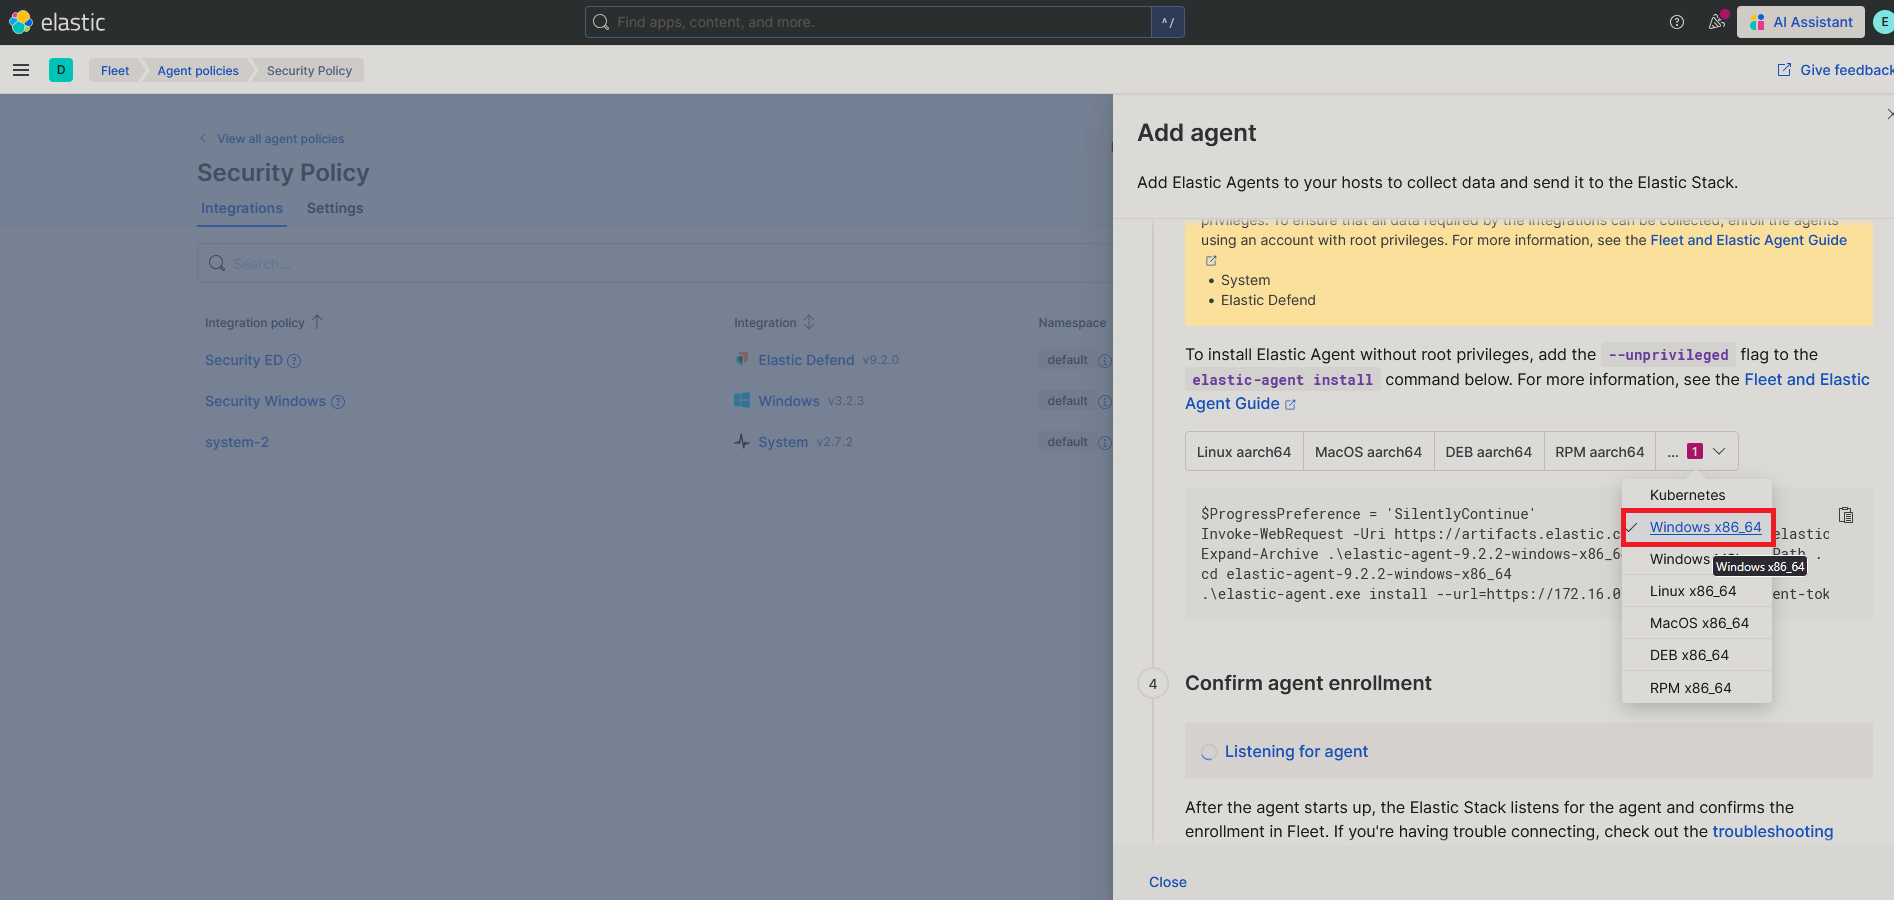
-
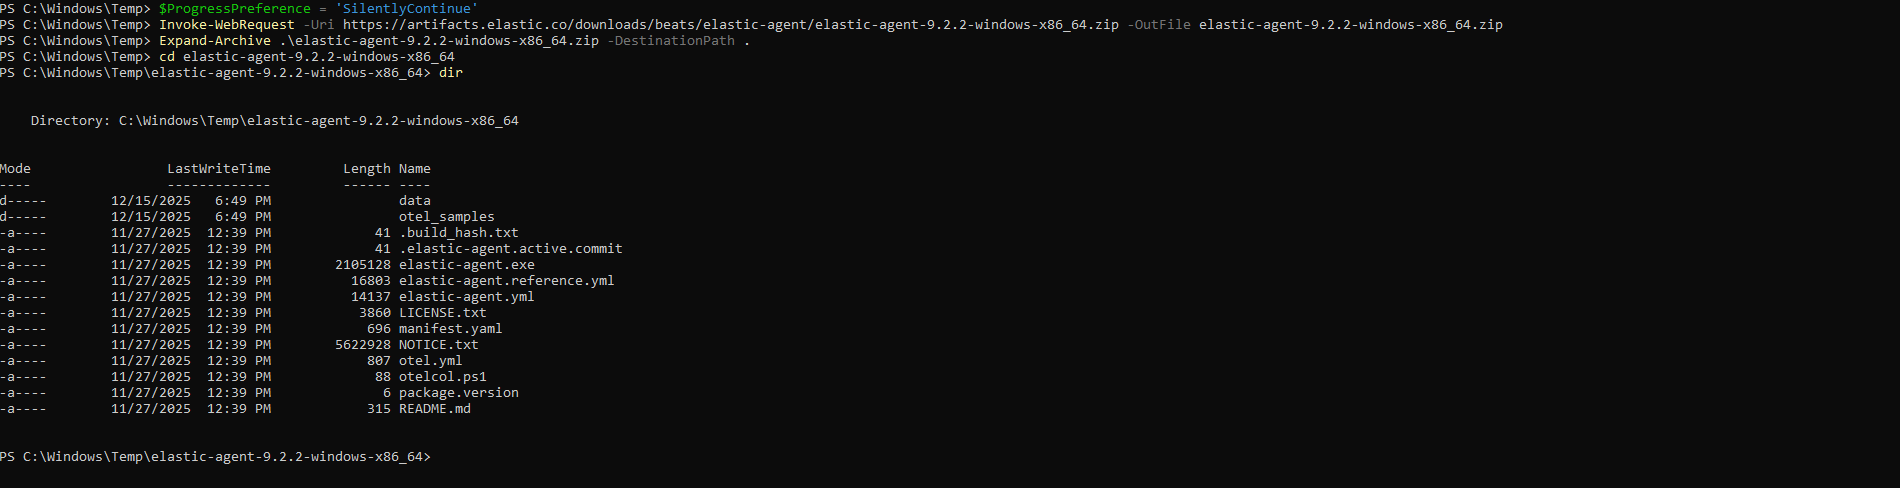
Open an Administrator terminal on the host you want to collect from and switch to a directory that you can safely create files in, such as
C:\Windows\Temp.
-
Go back over to your browser and copy all but the last line from Kibana and past that into your administrator terminal.
-
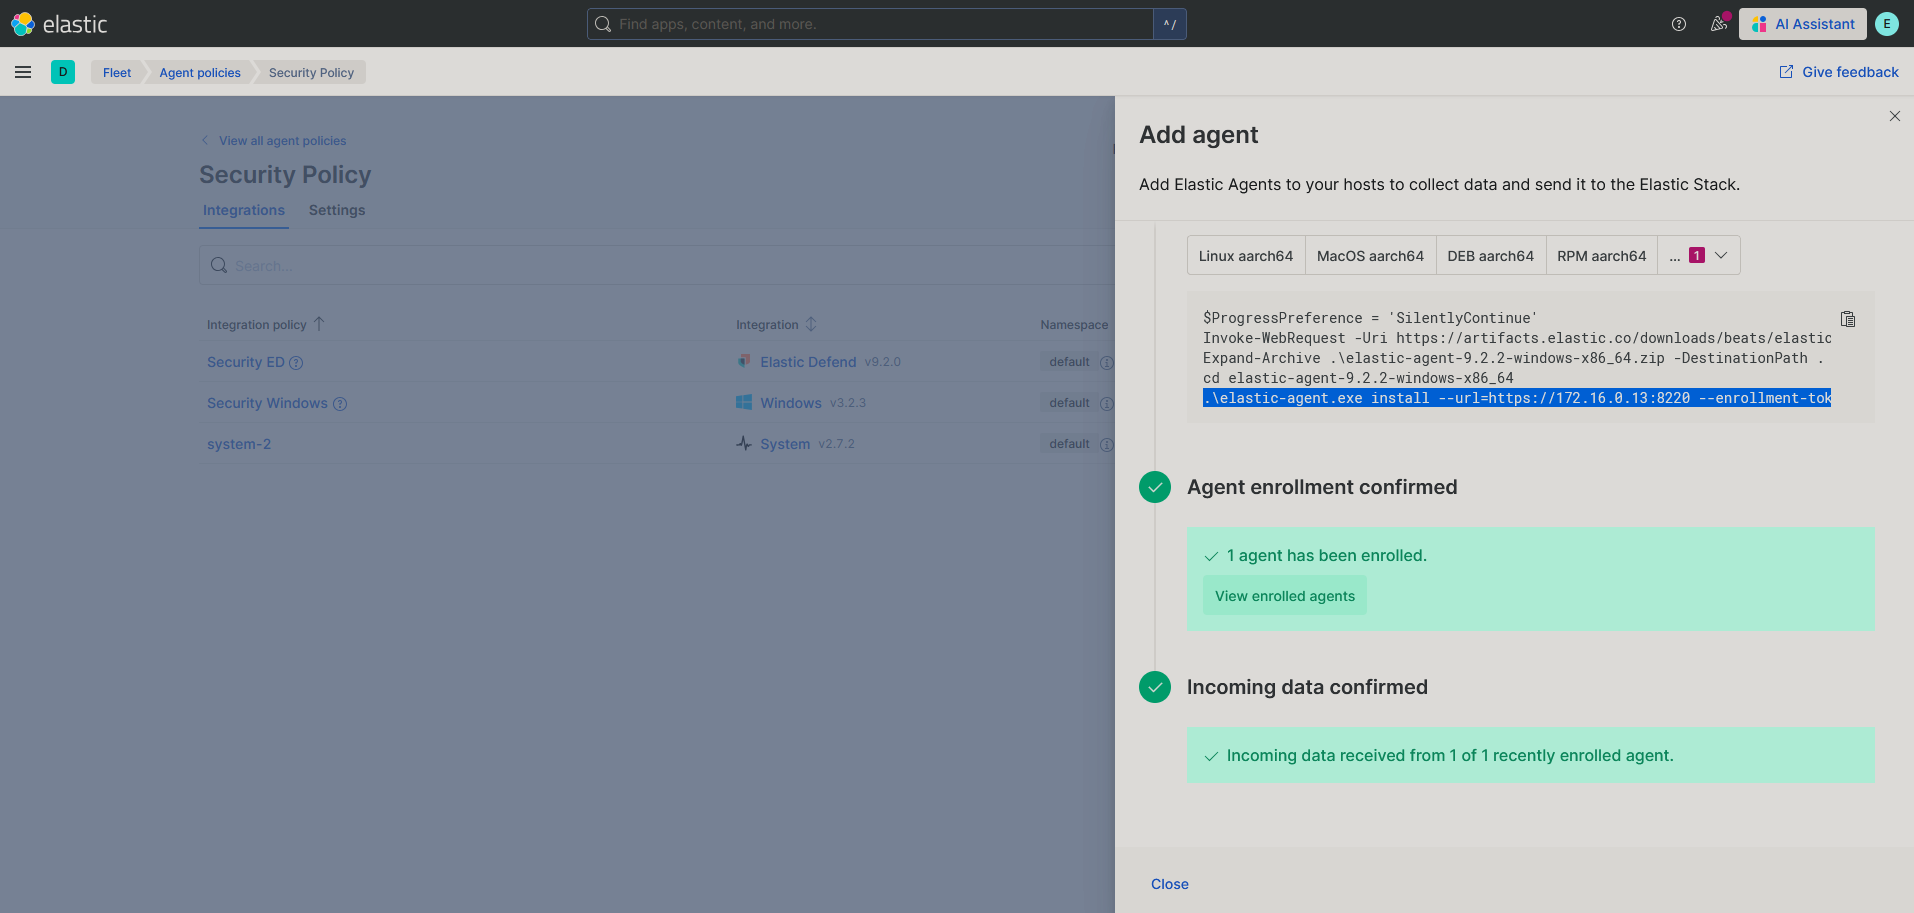
Now grab the final line that would install the elastic agent. Append
--insecureto the end of it. This is necessary as we are using our own TLS certificates without a CA. After appending insecure, run the command and follow the directions provided. Your terminal should look something like the following:> .\elastic-agent.exe install --url=https://172.16.0.13:8220 --enrollment-token=RHVkZSwgZ28gZ2V0IHlvdXIgb3duIGNlcnRpZmljYXRlIHRva2VuISA+Oig= -- insecure -
After completing this, back in your browser you’ll see the following, indicating that you have successfully installed the agent.
After completing either of these you can navigate to your fleet page and observe that you have the agents installed. NOTE: In my example you’ll see one of the hosts as offline, this was intentional for me. After you install a agent on a host you should see it appear with a “Healthy” status. 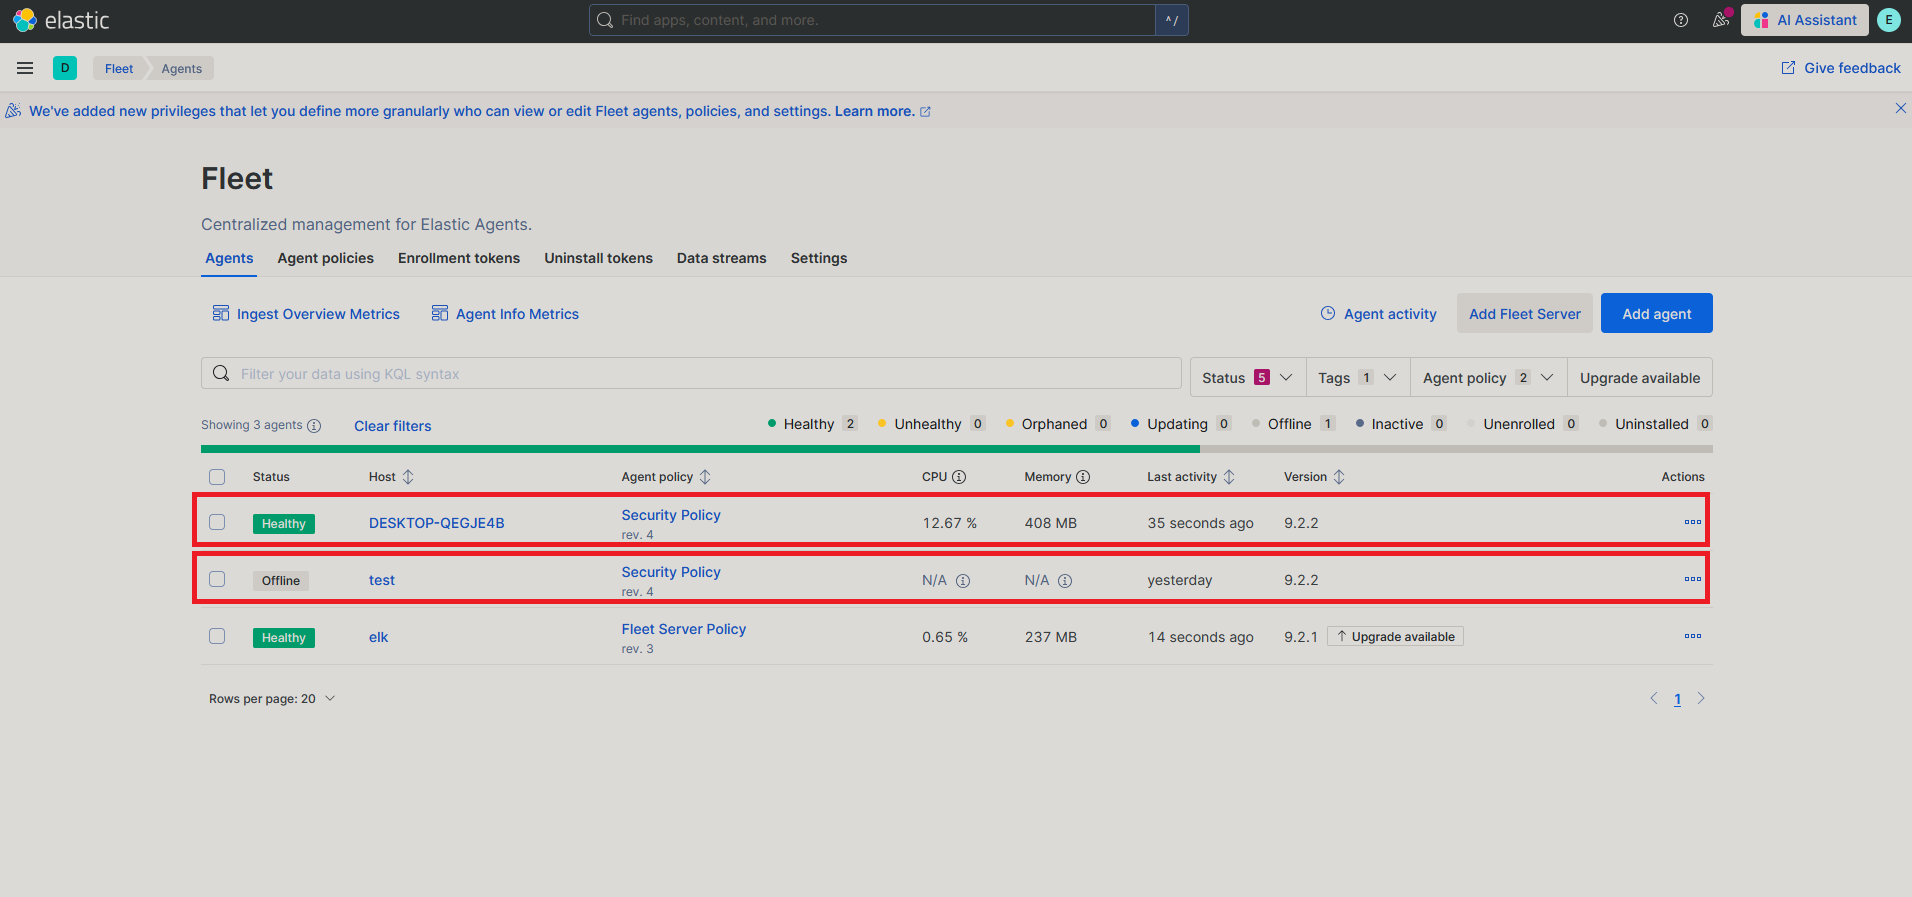
Configuring Alerts
What to Create Alerts On
The primary purpose of your SIEM should be to keep an eye on all of your machines. However, it is not reasonable to search for IOCs on every host that you connect. So you should create alerts to notify you when something should be investigated. This can be a hard thing to do and there are many ways to go about it. One thing is true regardless, your alerting rules will continue to grow and change over time. In my personal opinion, the best place to start is with the MITRE ATT&CK framework. This is a framework that lists a knowledge base of known adversary tactics and techniques. For your specific setup, not all tactics will be applicable to you, such as T1201 (Password Policy Discovery). However, it is a good place to start. Below I’ve included some other sources that give good advice on creating alerts for your SIEM.
How to Create an Alert
The main point of an alert is to cause further action when a certain log or pattern of logs appear. In a traditional SOC this is where a playbook would run to automate the remediation process and or an analyst would jump in to investigate. For our purposes we will create an alert that appears on the alert page and prompts you to investigate. For our demonstrative purposes, we will create a very simple alert for a failed linux authentication.
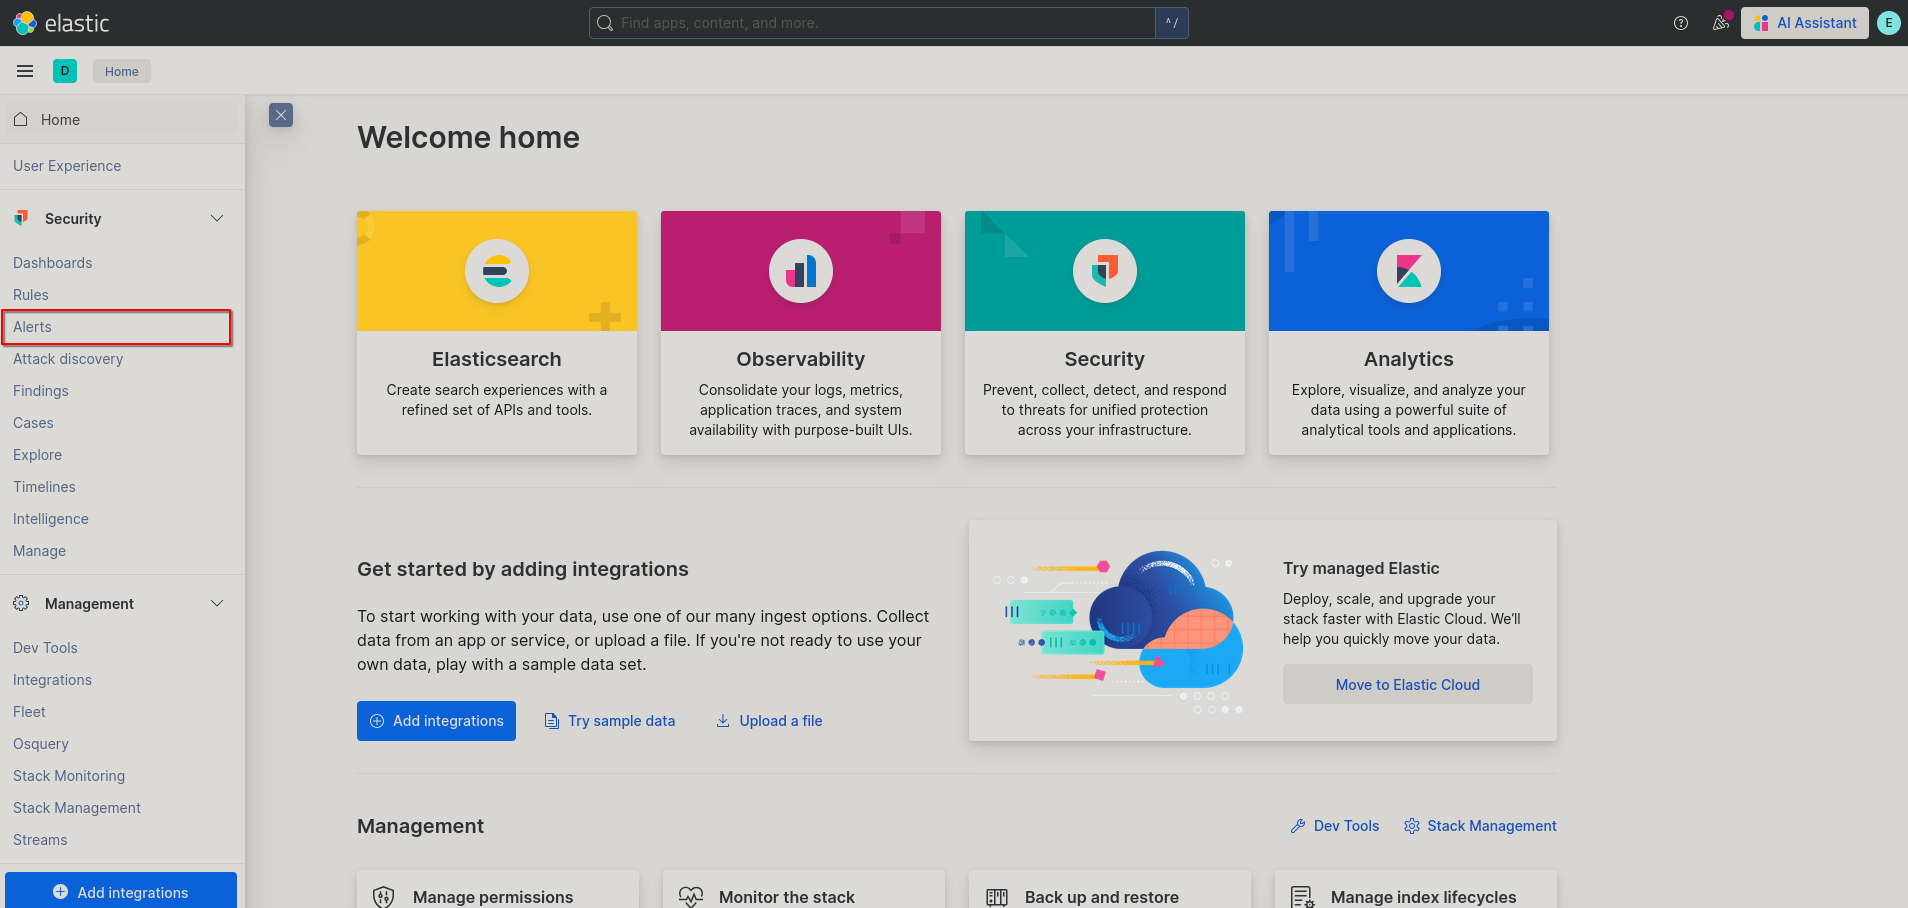
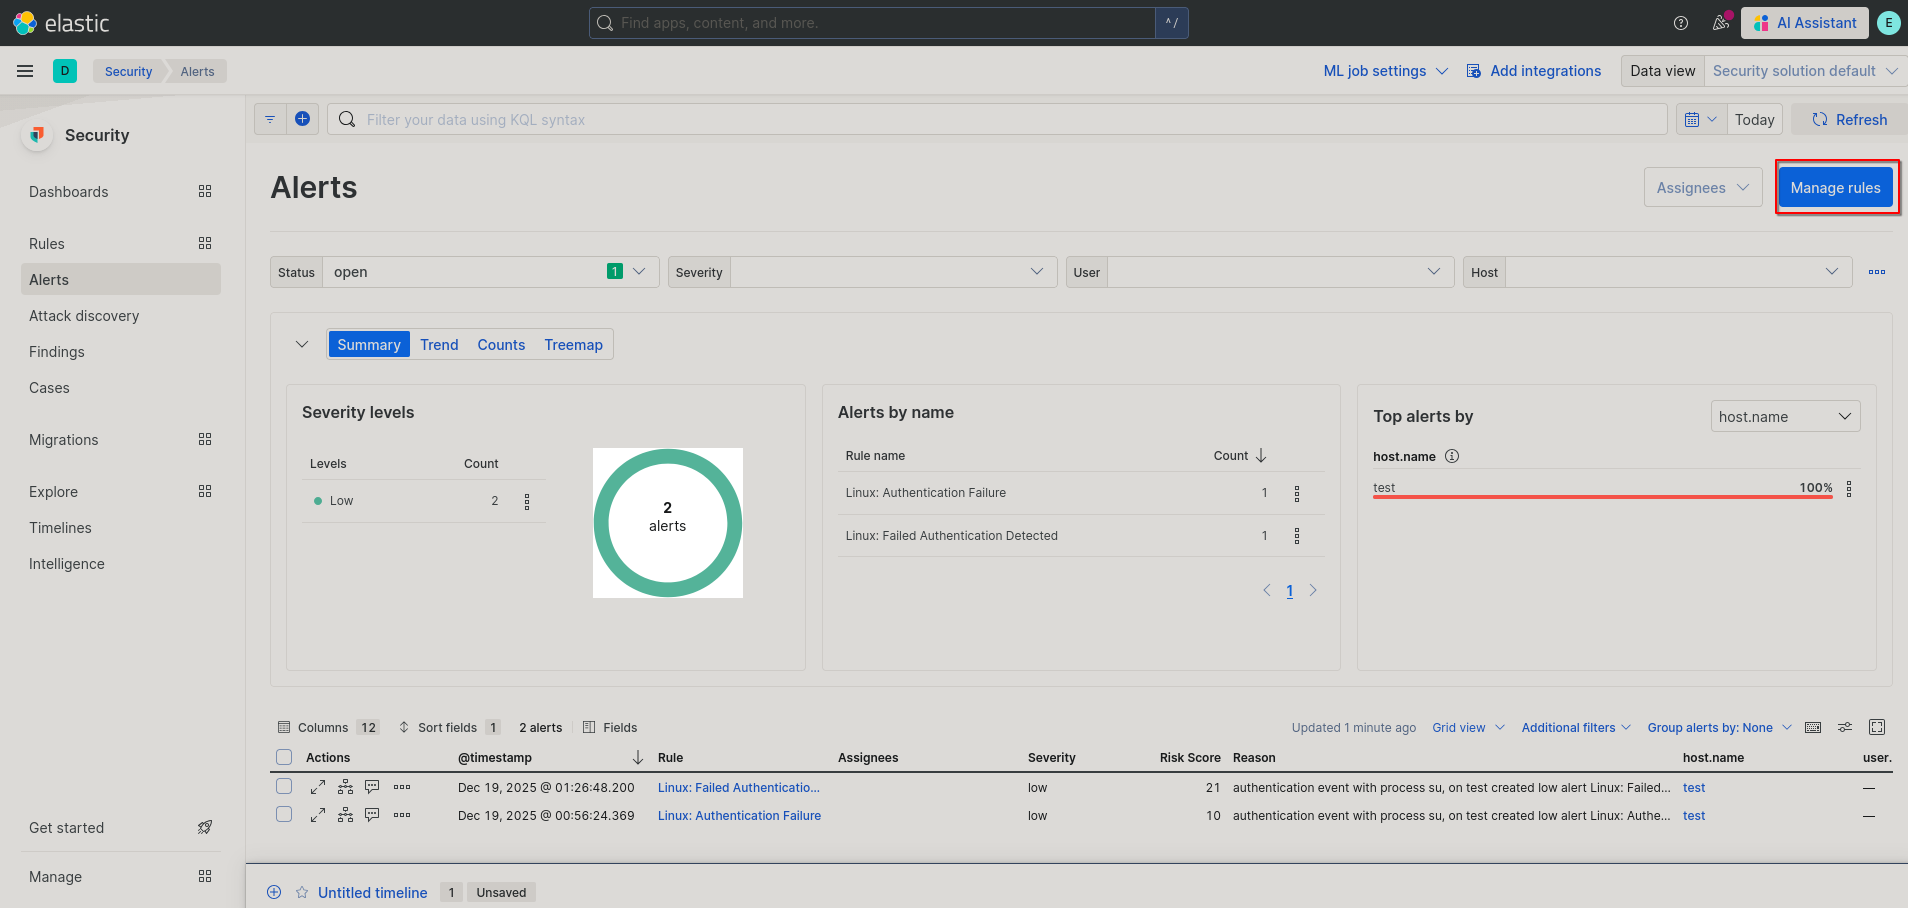
- From the Kibana homepage click the three bars in the top left and go to Security > Alerts.
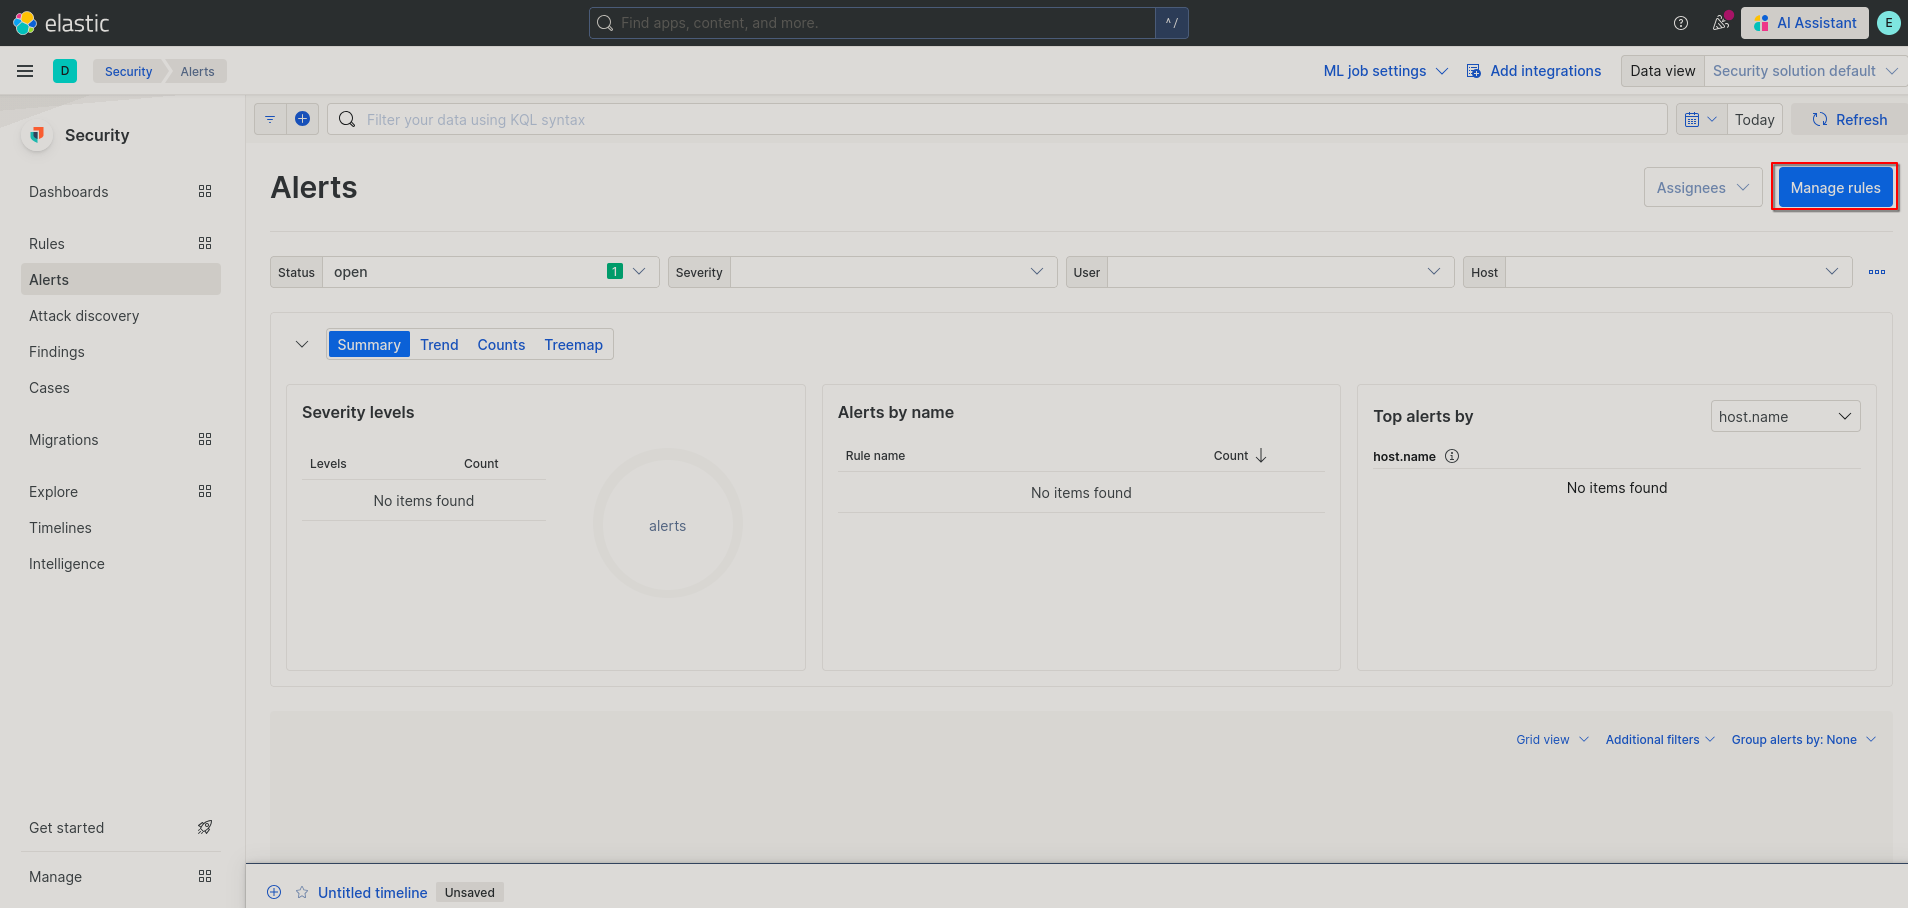
- Next in the top left click on “Manage rules”.
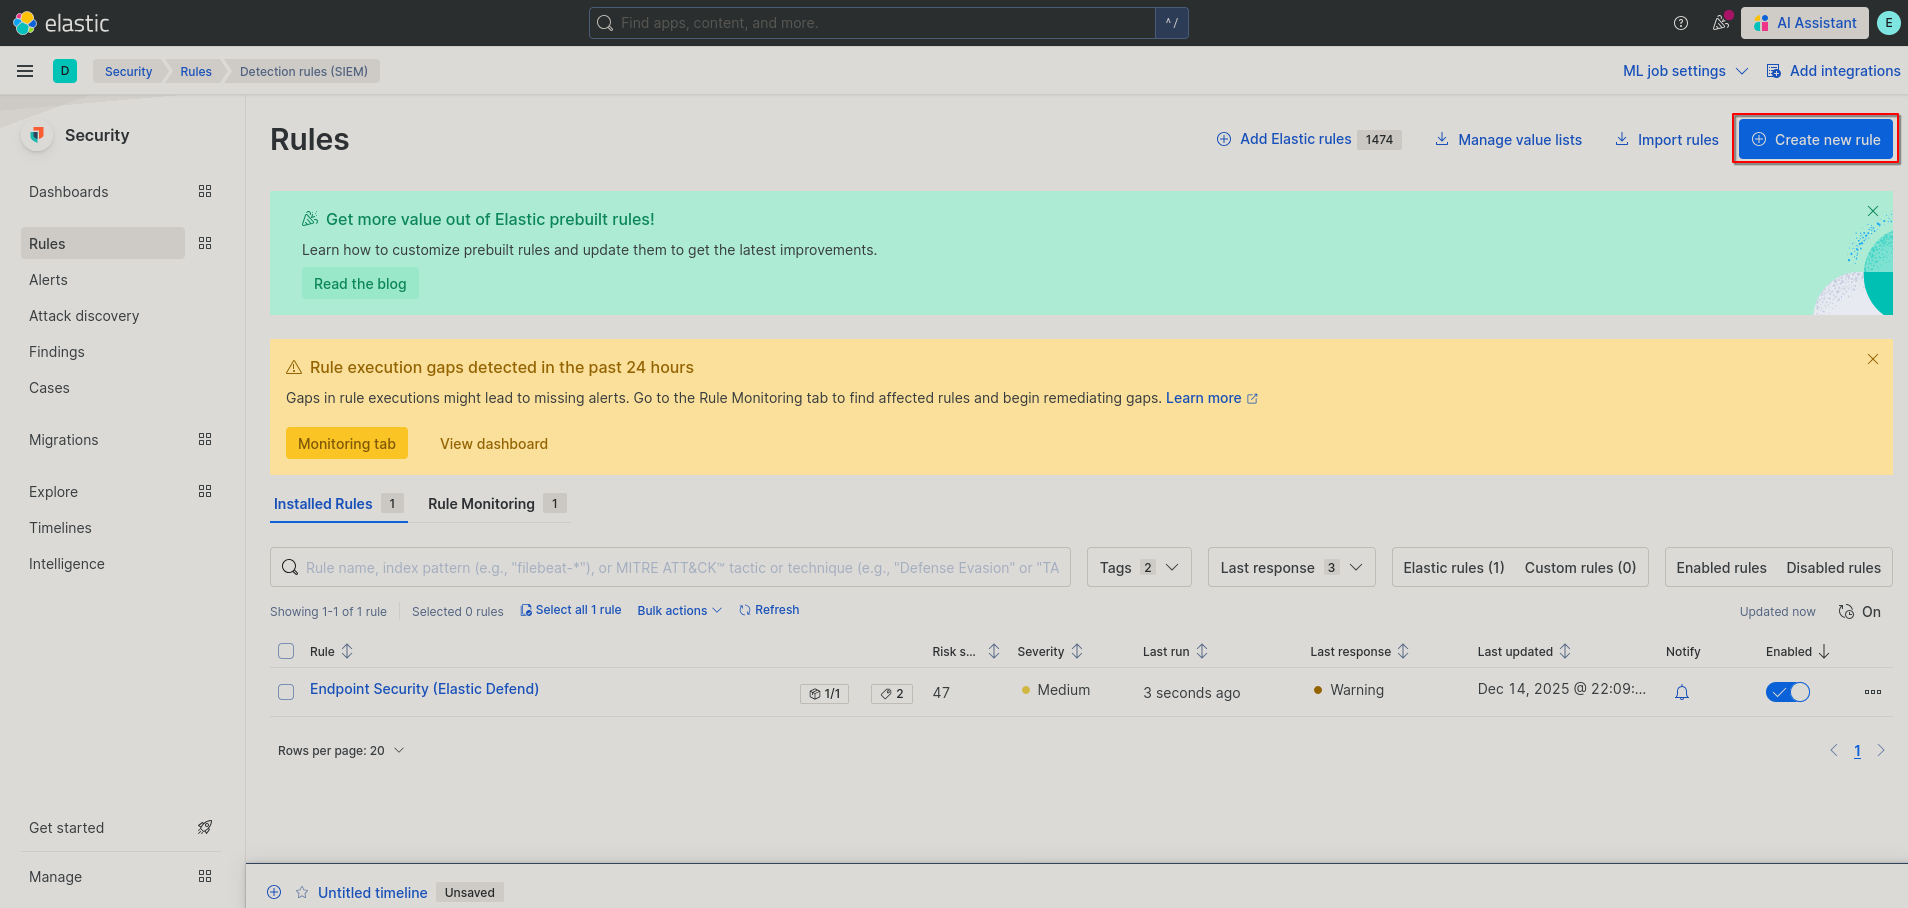
- Now you’ll be on the rules page, click on “Create new rule”/“Manage rules” in the top left.
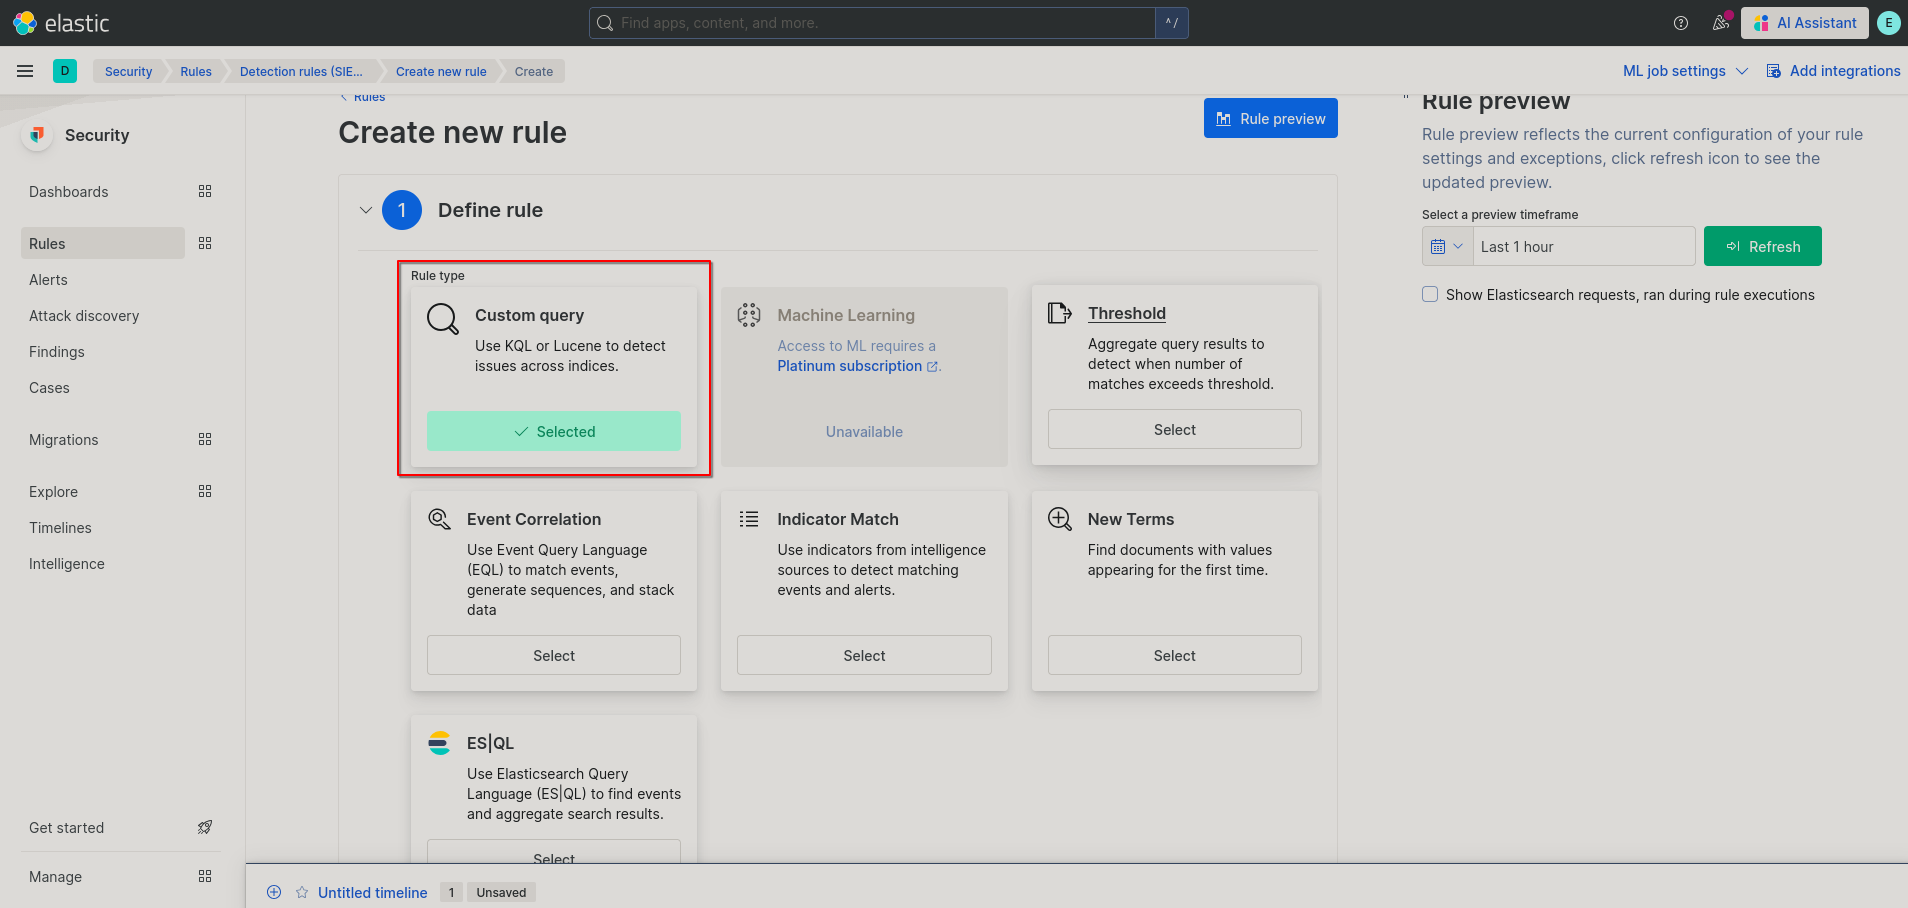
- You’ll now be on the rule creation page.
-
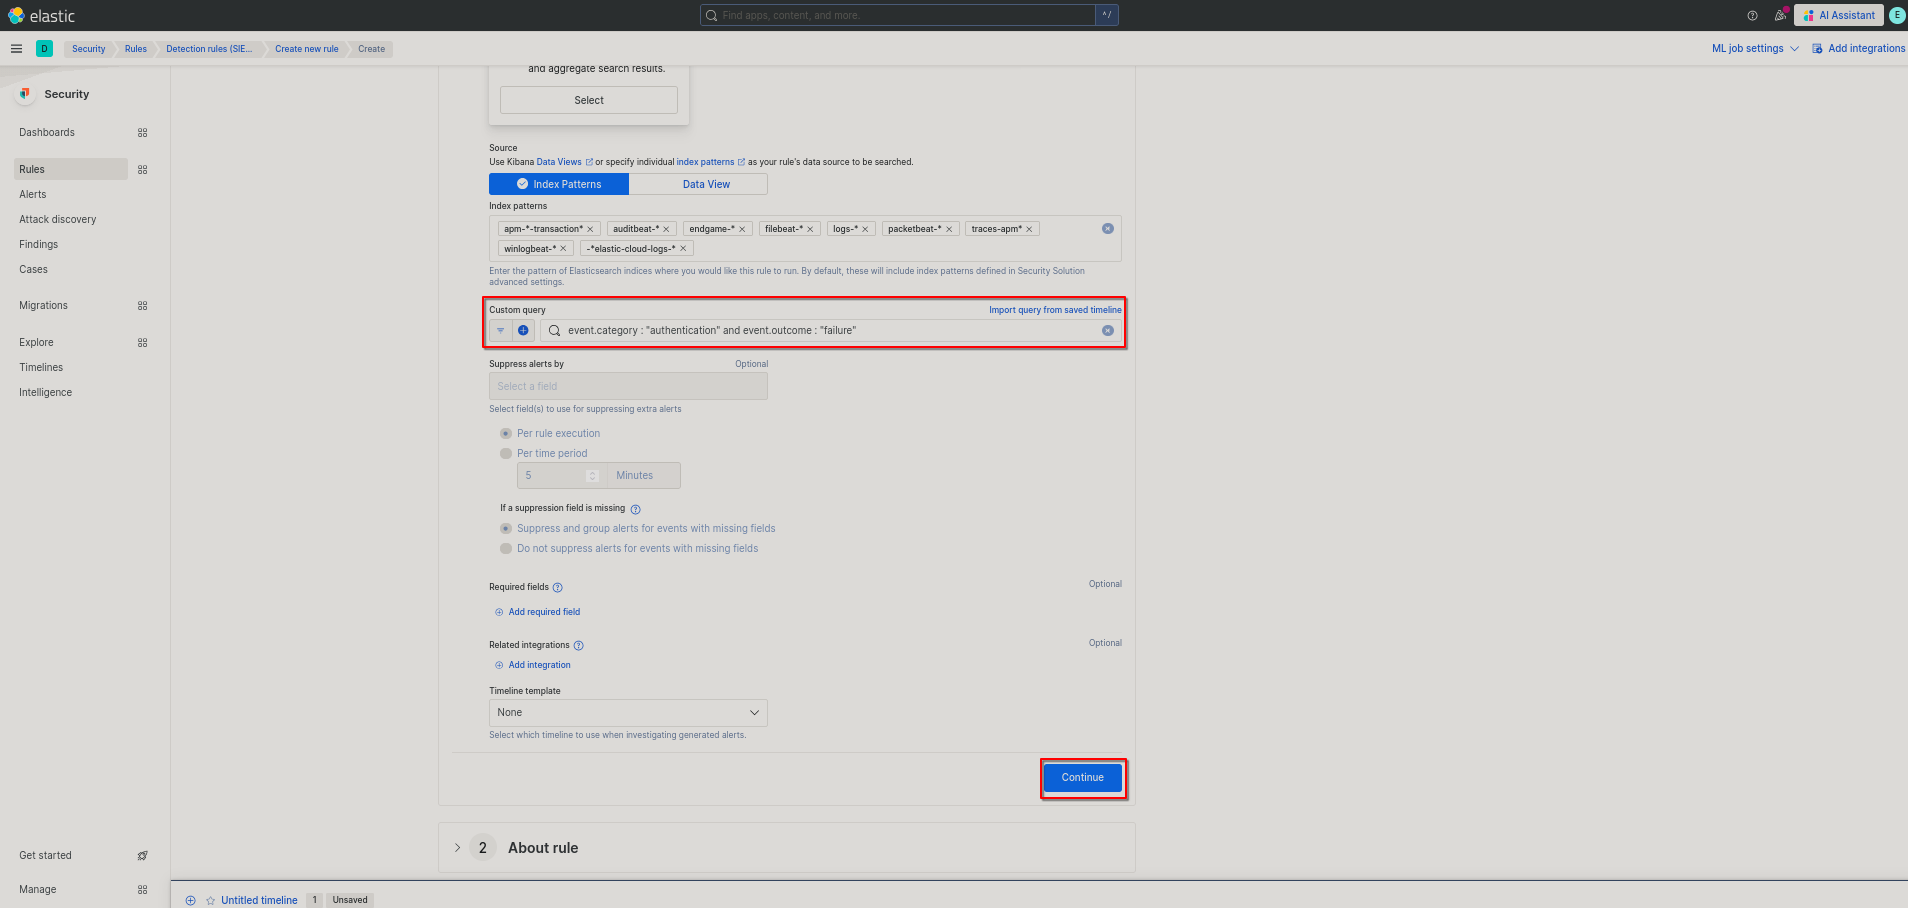
For step 1, you can leave the rule definition as a Custom query.
 If we wanted our rule to be more efficient we would find out what index the alerting logs come from, for right now we’ll leave them be. Next for the Custom query we will be using the following:
event.category : "authentication" and event.outcome : "failure"Finally we’ll leave the rest as is and click continue in the bottom right.
-
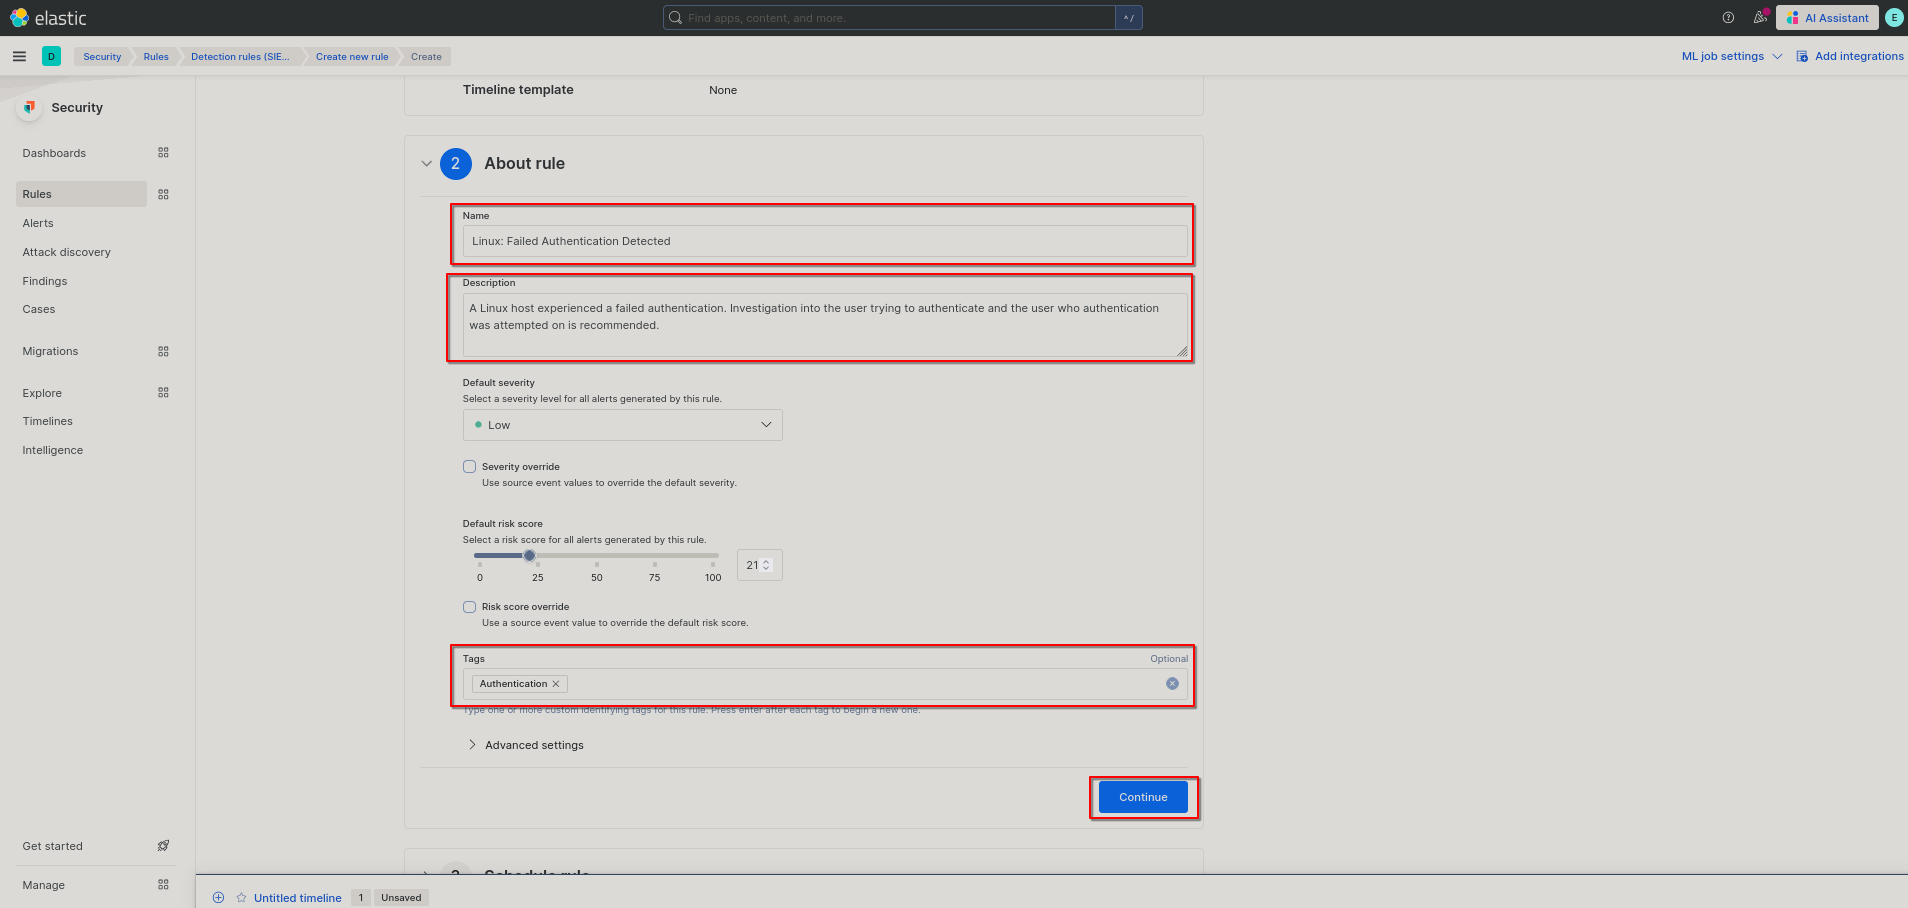
Next we’ll give our rule a meaningful name and description. This will be shown when an alert triggers so make sure what you type makes sense to you later. You can assign a different severity level and risk score if you want, but I’ll leave mine as is. I’ll tag this alert with “Authentication” to make rule management down the line easier. Finally, click the Continue button.
-
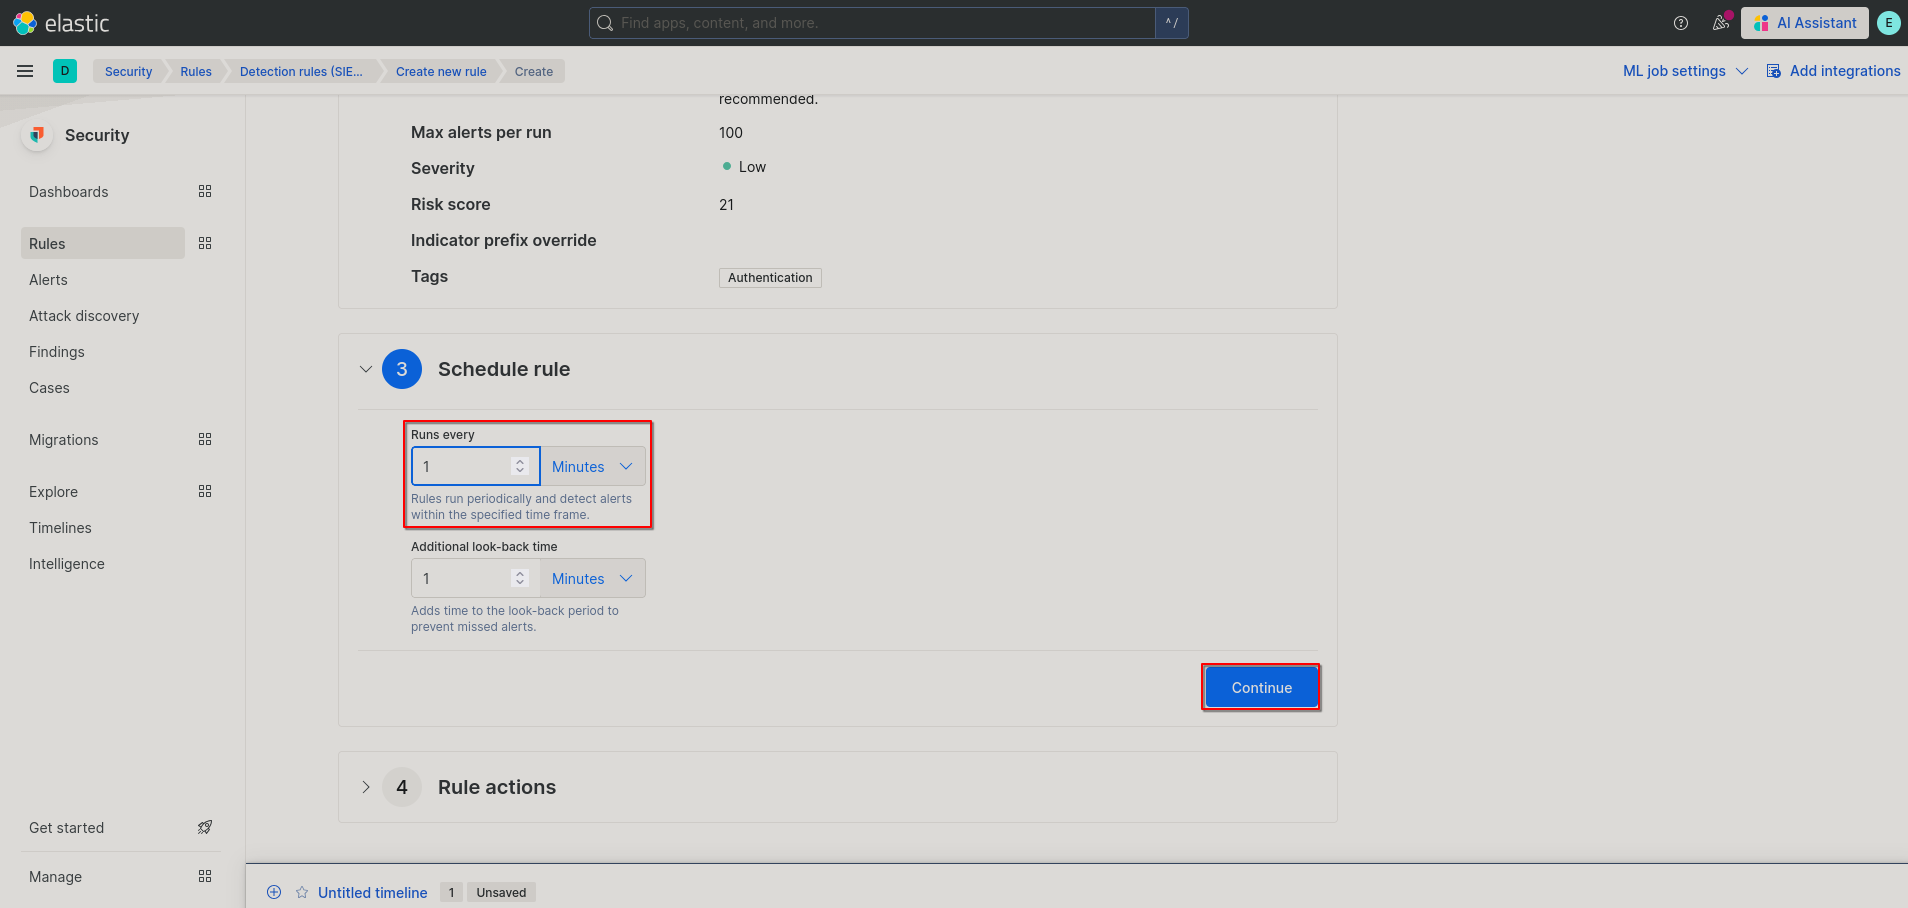
Next we are directed to make a schedule for the rule, which is just how often it is run. With this alert I’ll change the “Runs every” field to 1 minute. It is important to note the more you run a command the more intensive it is on the server. To progress click on the continue button.
-
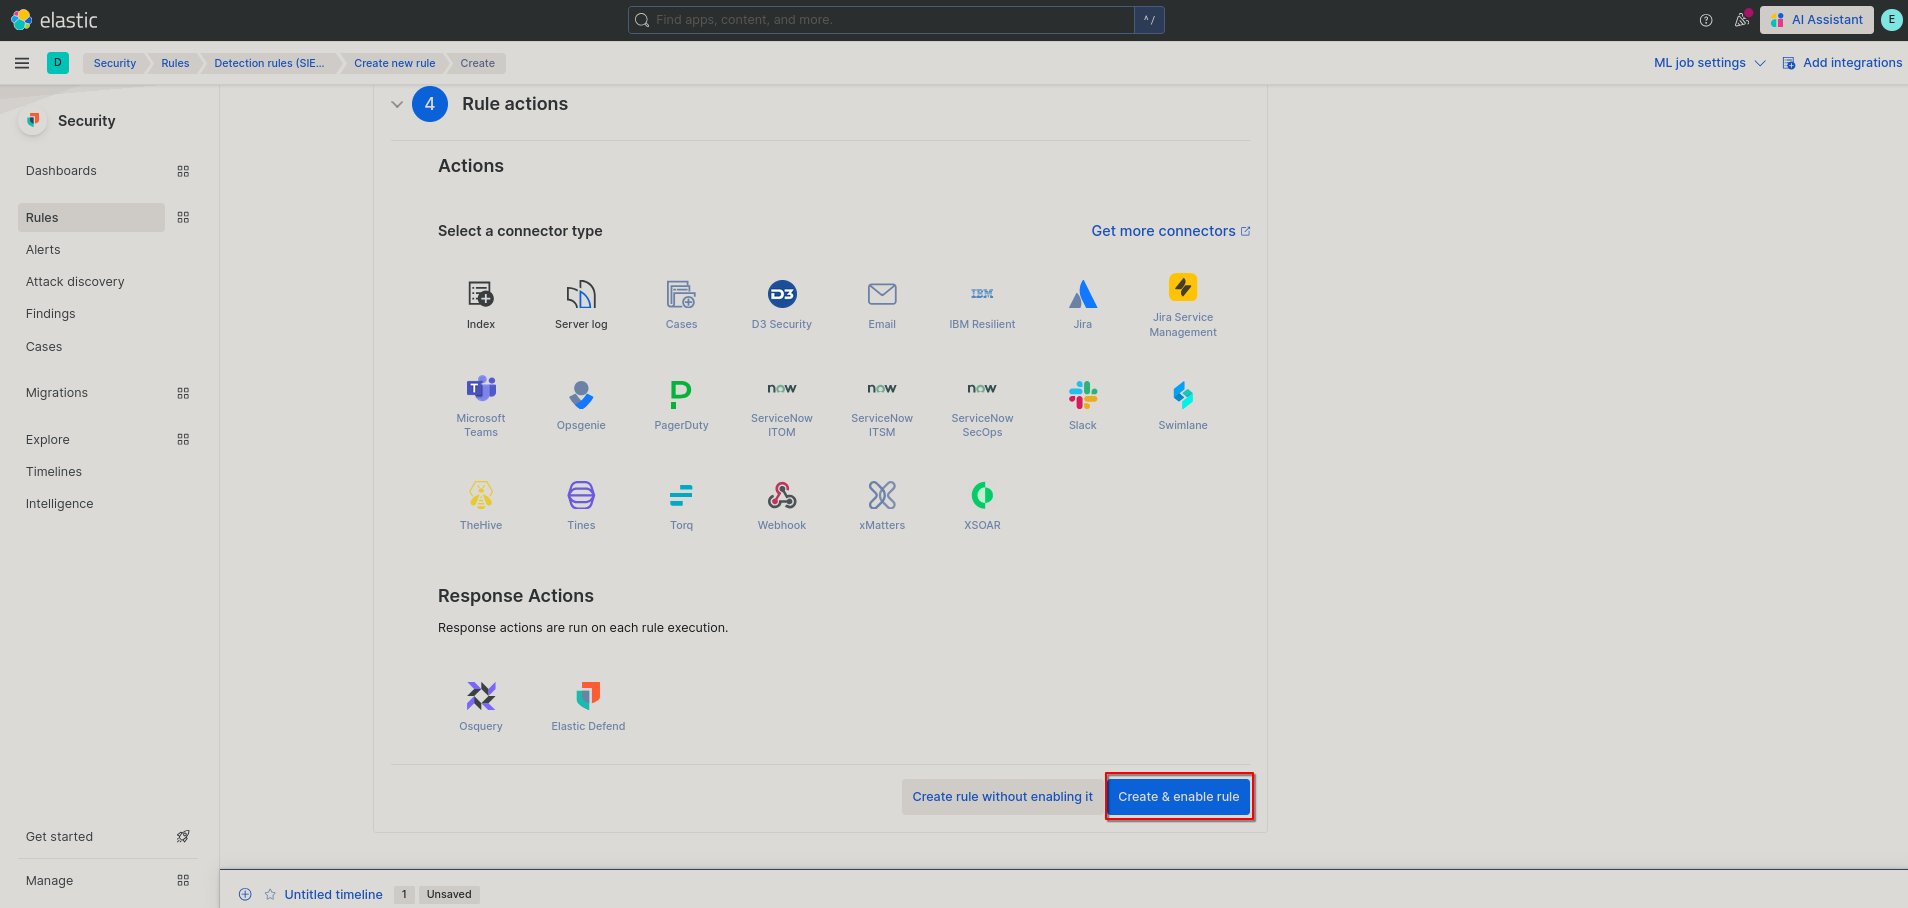
Finally for rule actions we will be skipping over them for the time being and just clicking “Create & enable rule”
-
- Now you can fail an authentication on a connected Linux host (for example fail
$ su root). Wait a little and click the refresh button in the top right. Now, you’l be able to observe the alert triggering!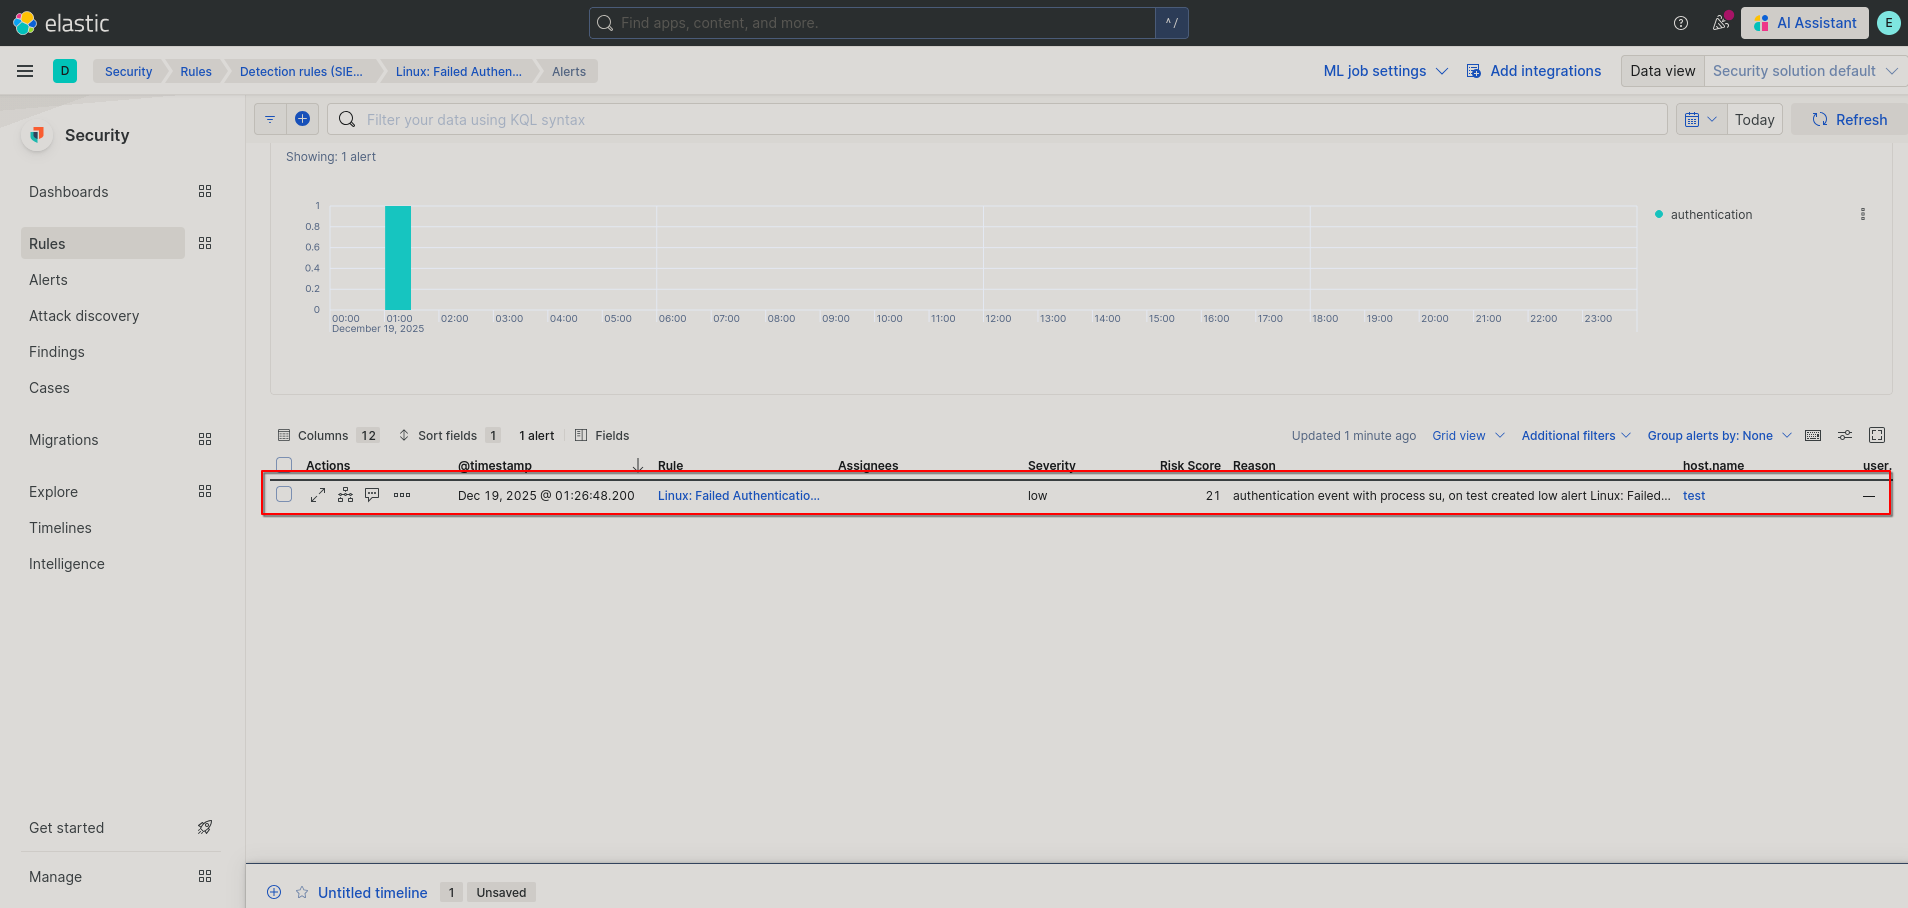
Now that we know how to make an alert we can write up a report about it and close it out (Click on those three dots to in the report then click on “Mark as closed”). However, making your own alerts is a lot of work. Next we’ll go over importing pre-configured alerts.
Importing Alerts
Elastic Provided
Luckily Elastic provides some alerting rules for us and makes them very easy to install.
- From the Elastic homepage go to Security > Alerts.
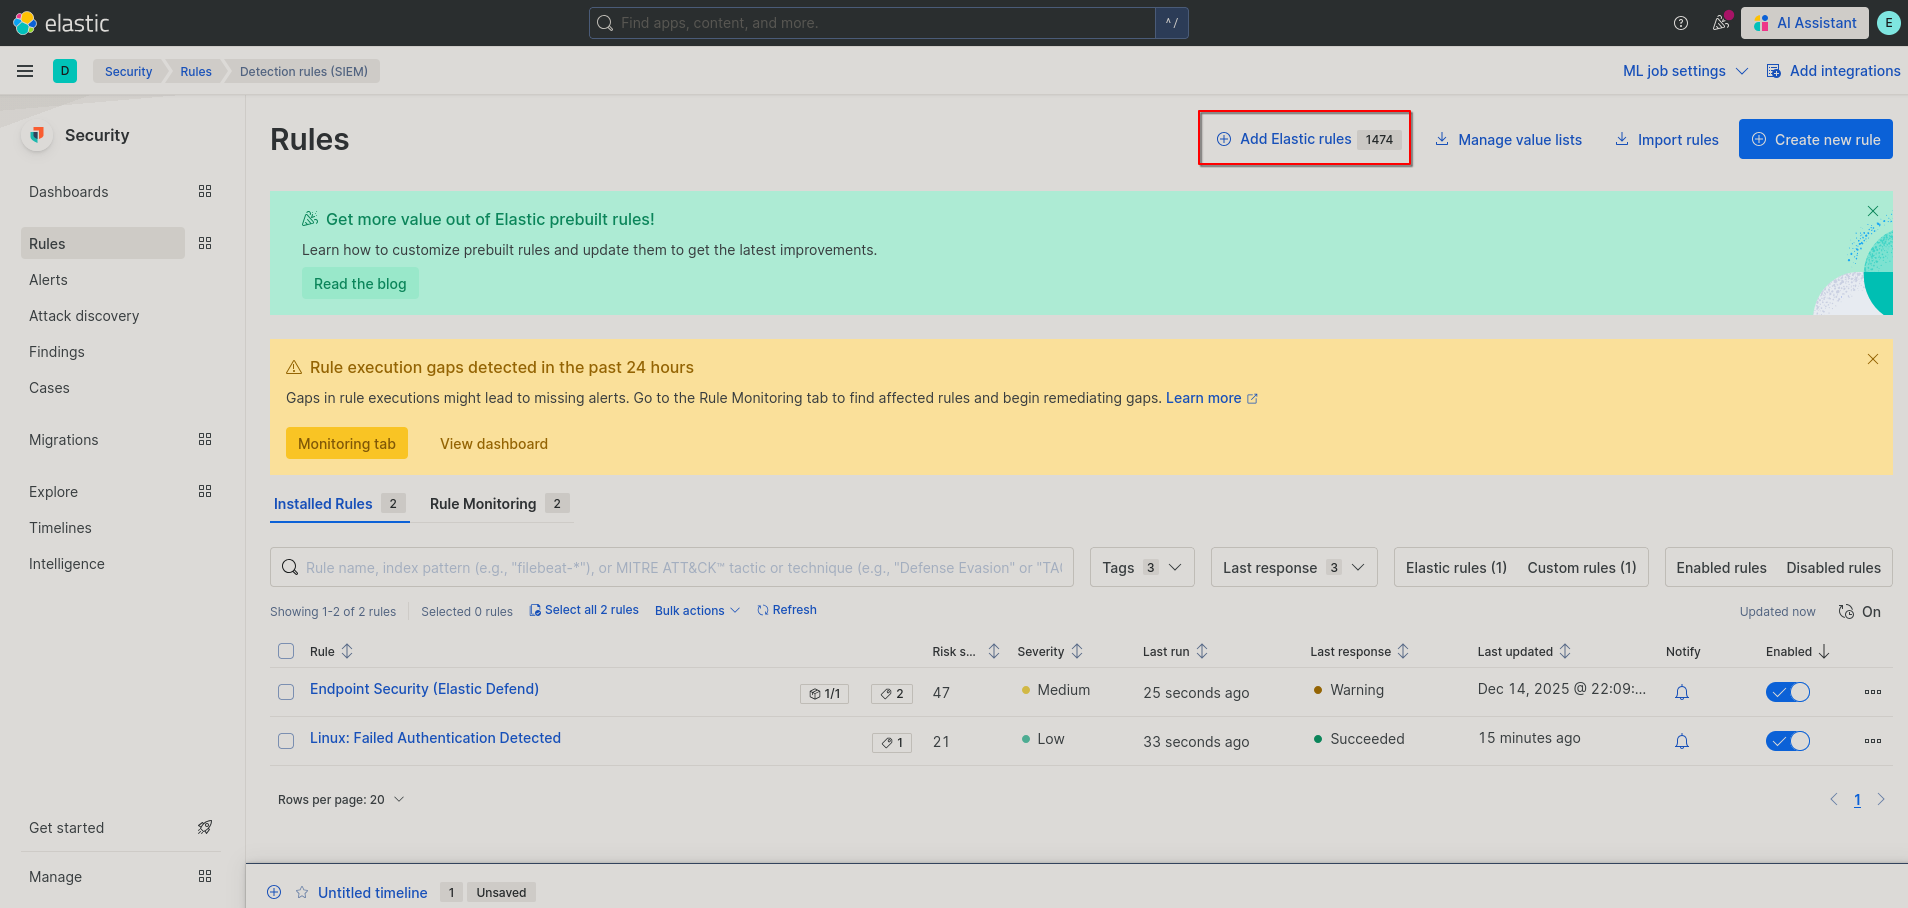
- From the Alert page click on “Create new rule”/“Manage rules”.
- At the top click “Add Elastic rules”. If prompted to leave a timeline, click confirm.
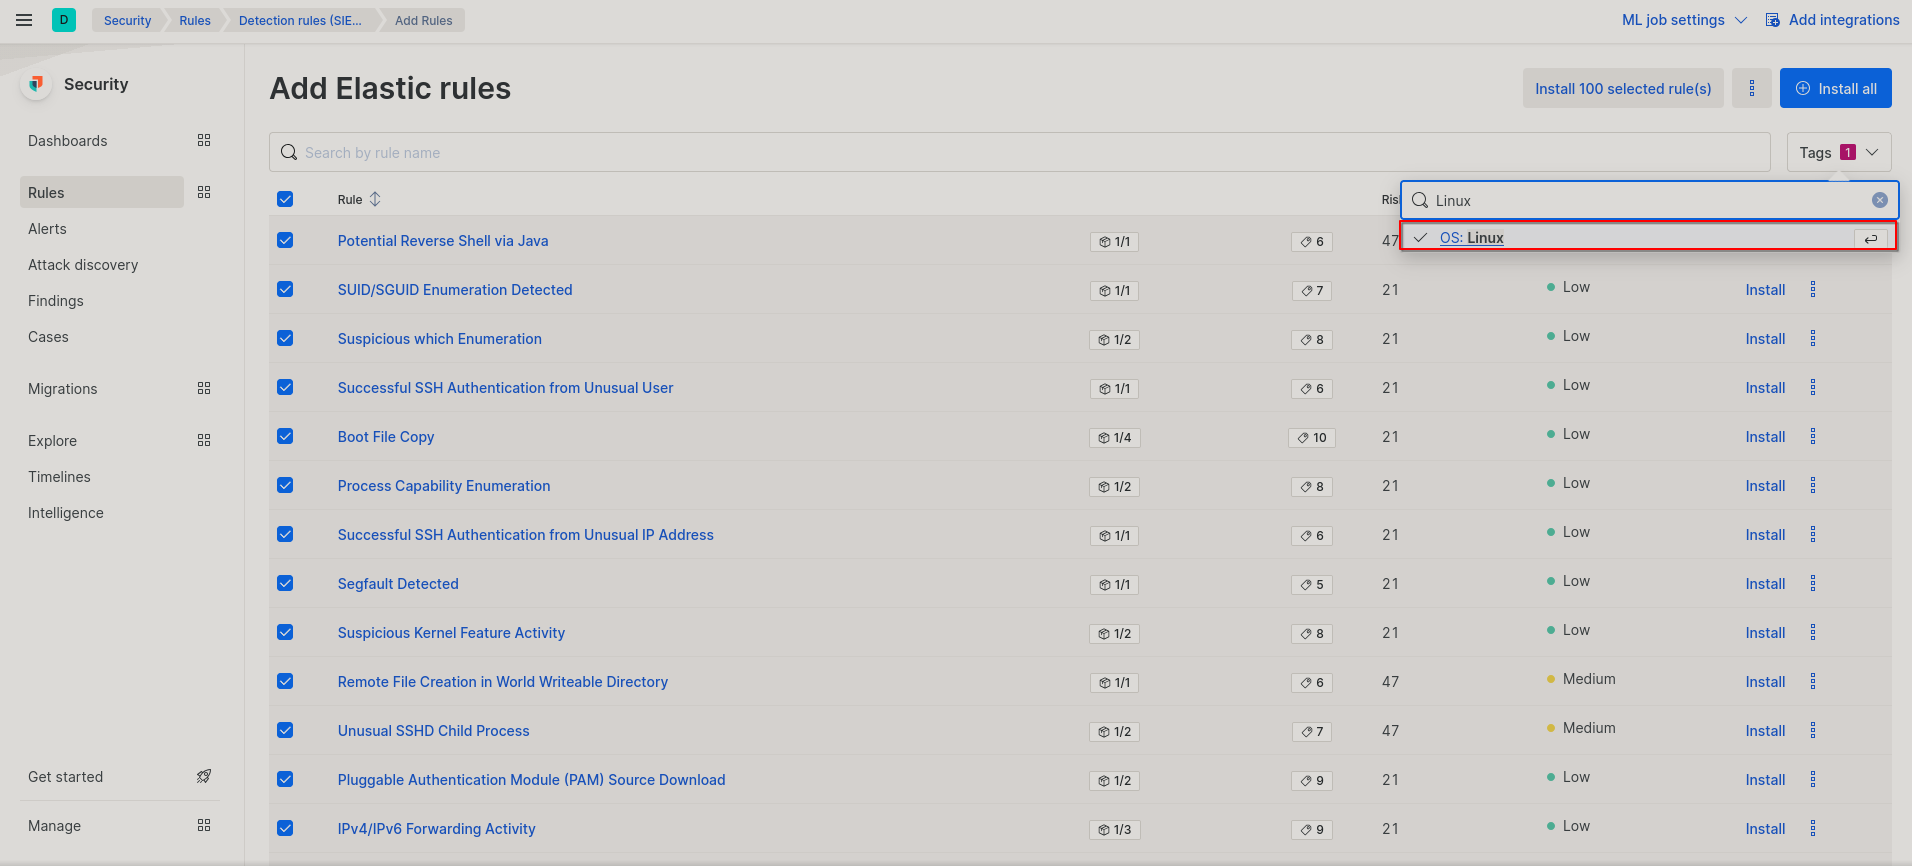
- Click on the tags drop down on the right then search for and select “OS: Windows”.
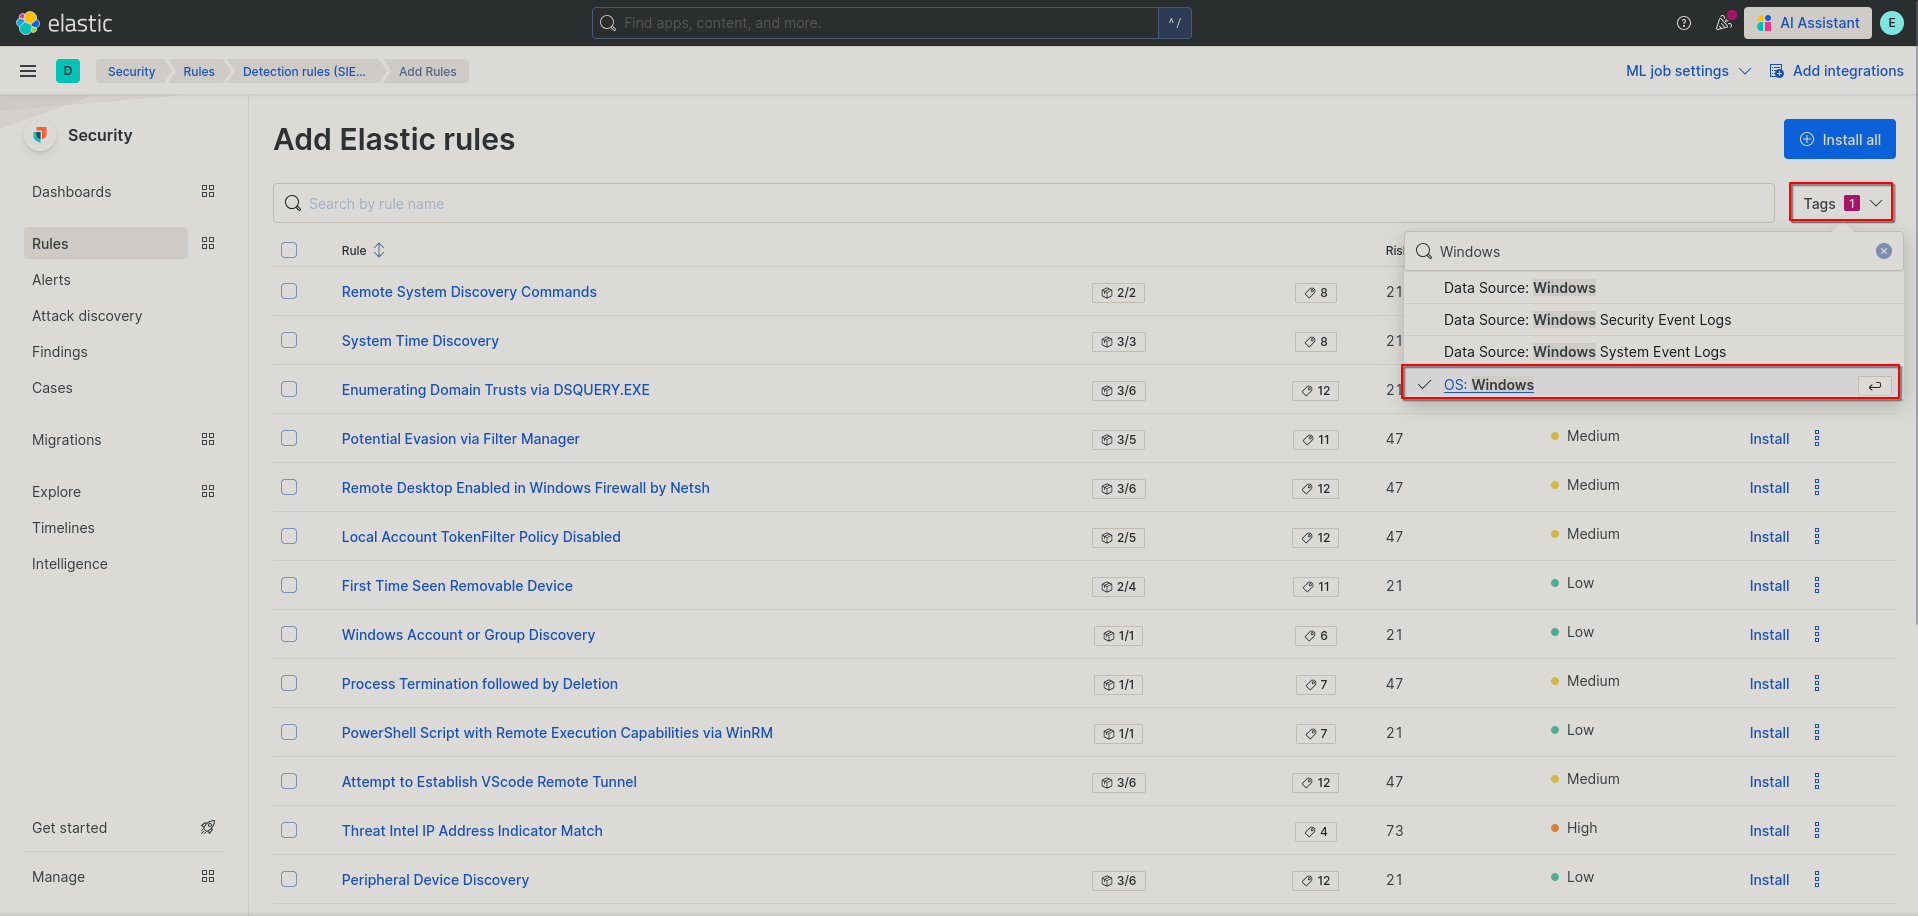
- Scroll down to the bottom of the page and change the rows per page to 100.
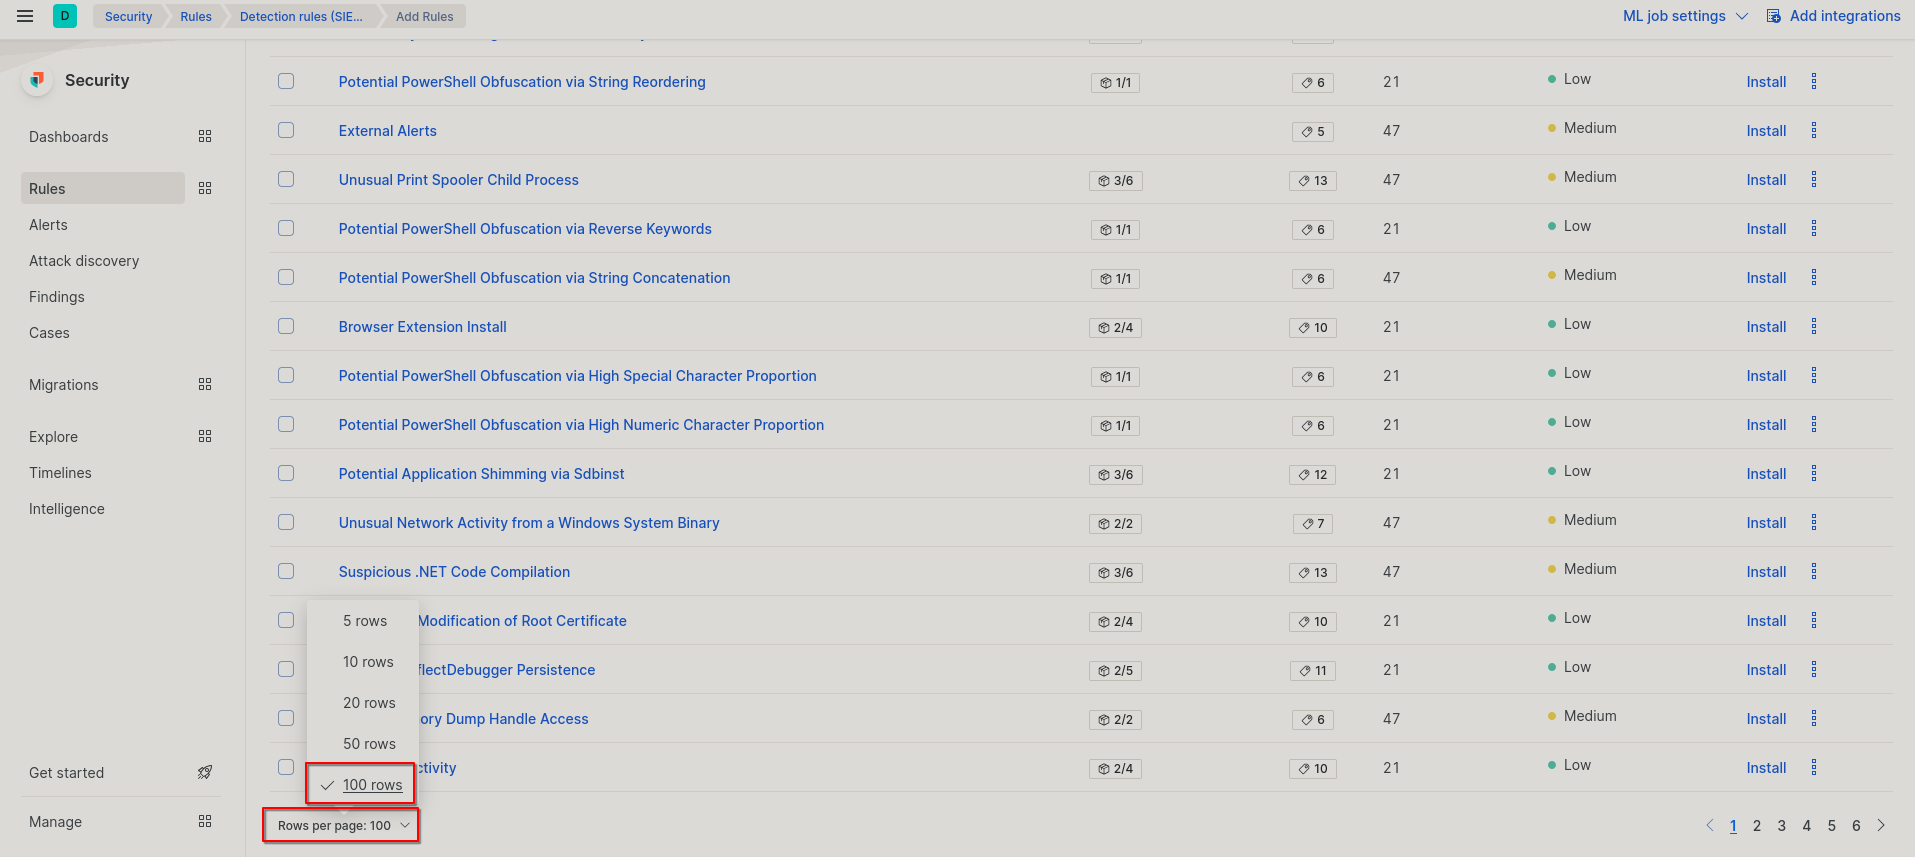
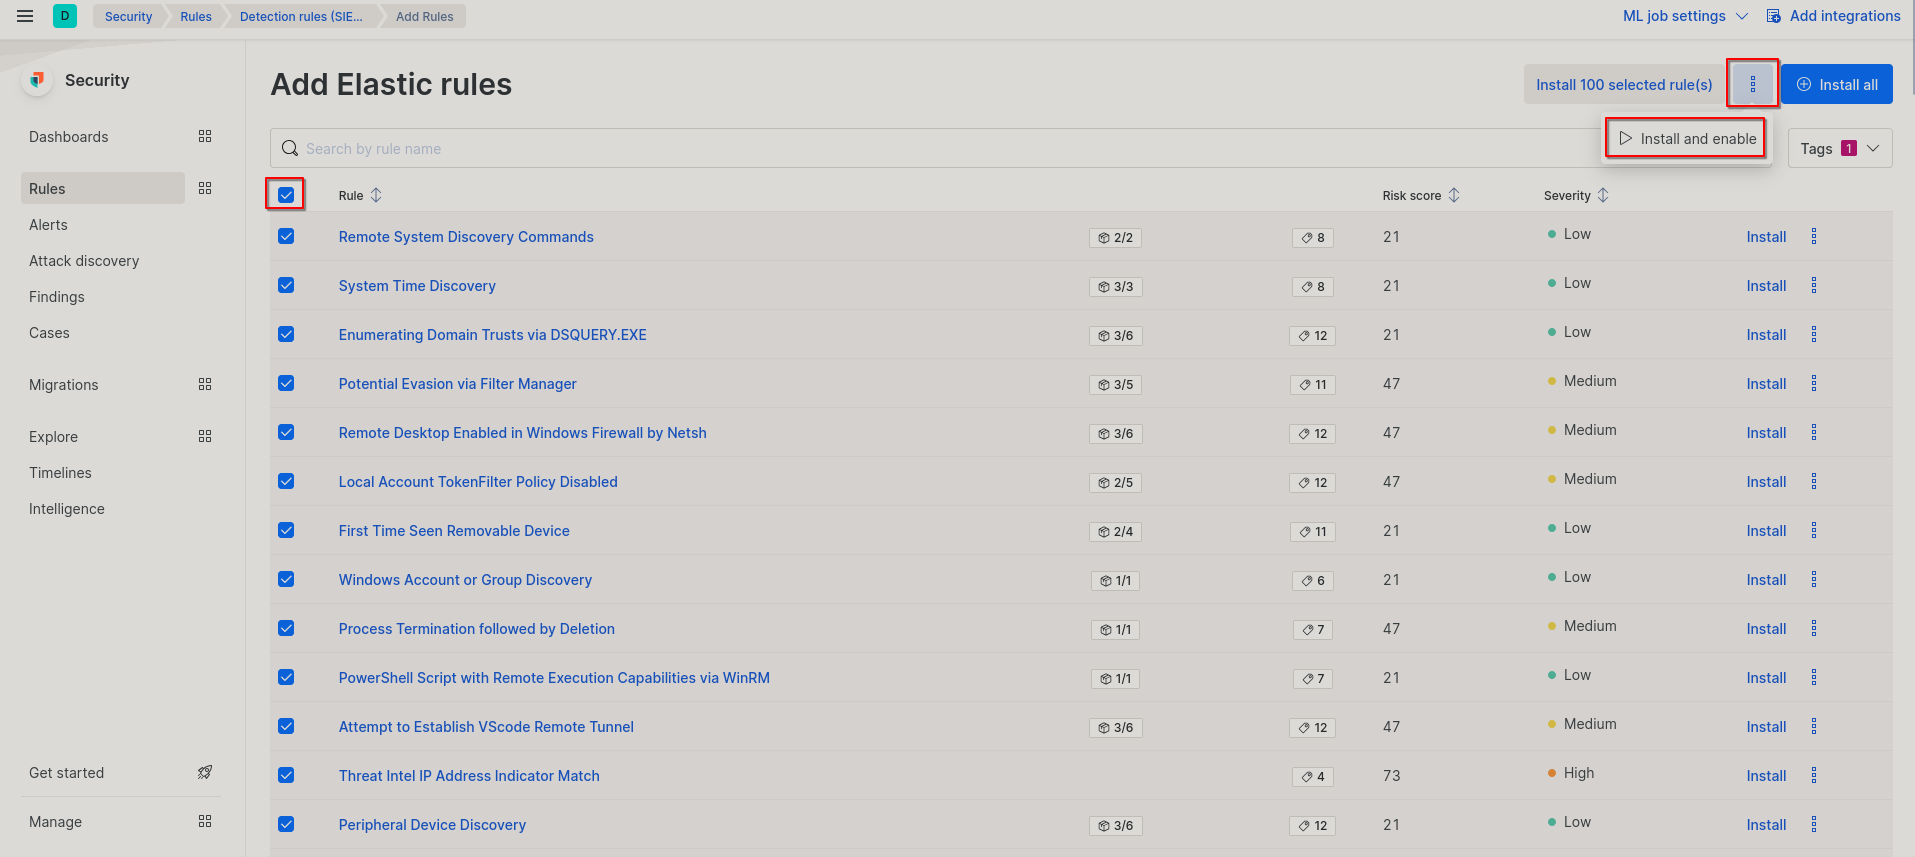
- Click the box in the top left to select all on your page. Then click the three vertical dots in the top left and click “Install and Enable”
- Repeat step 6 until no more windows rules remain.
- Repeat steps 6 and 7, but now with “OS: Linux”. Make sure “OS: Windows” is no longer selected.
 Now you have all of your Elastic rules installed and enabled!
External Alerts
Elastic also offers the ability to install community curated alerts via ndjson files. There are many places to get these, but one of the most popular rule sets is the SIGMA rule set. This involves generating this ndjson file from the sigma-cli which is outside of the scope of this guide. However a really good tutorial can be found here by Security-in-bits.
- From the Elastic homepage go to Security > Alerts.
- From the Alert page click on “Create new rule”/“Manage rules”.
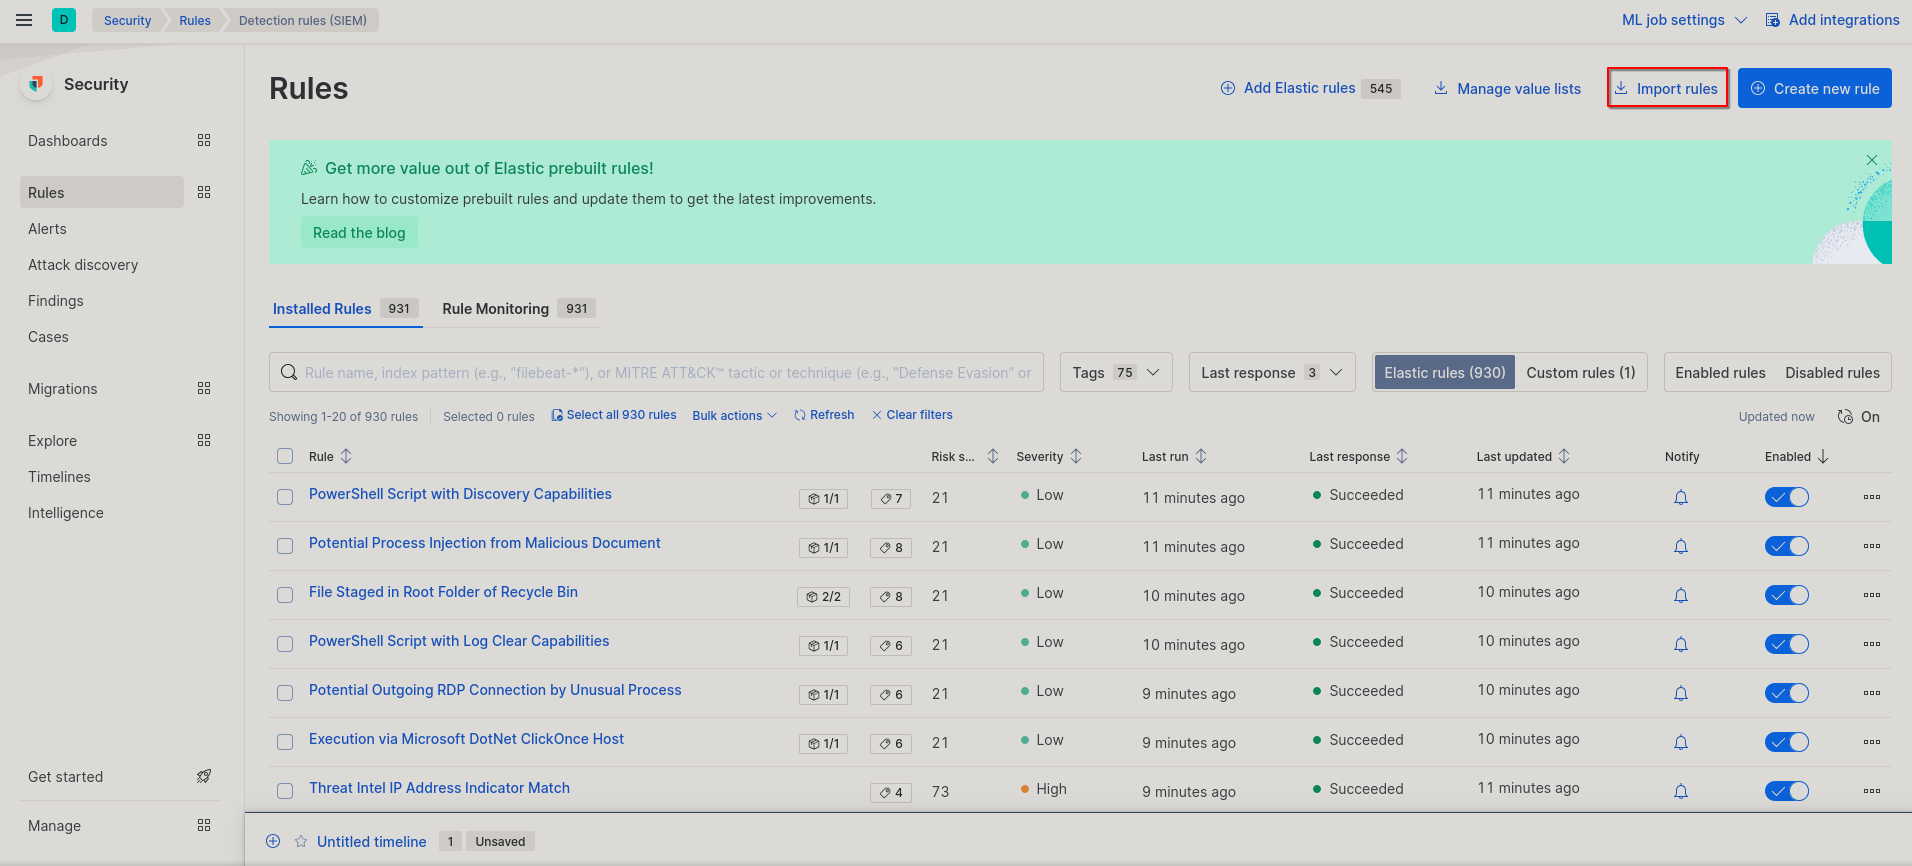
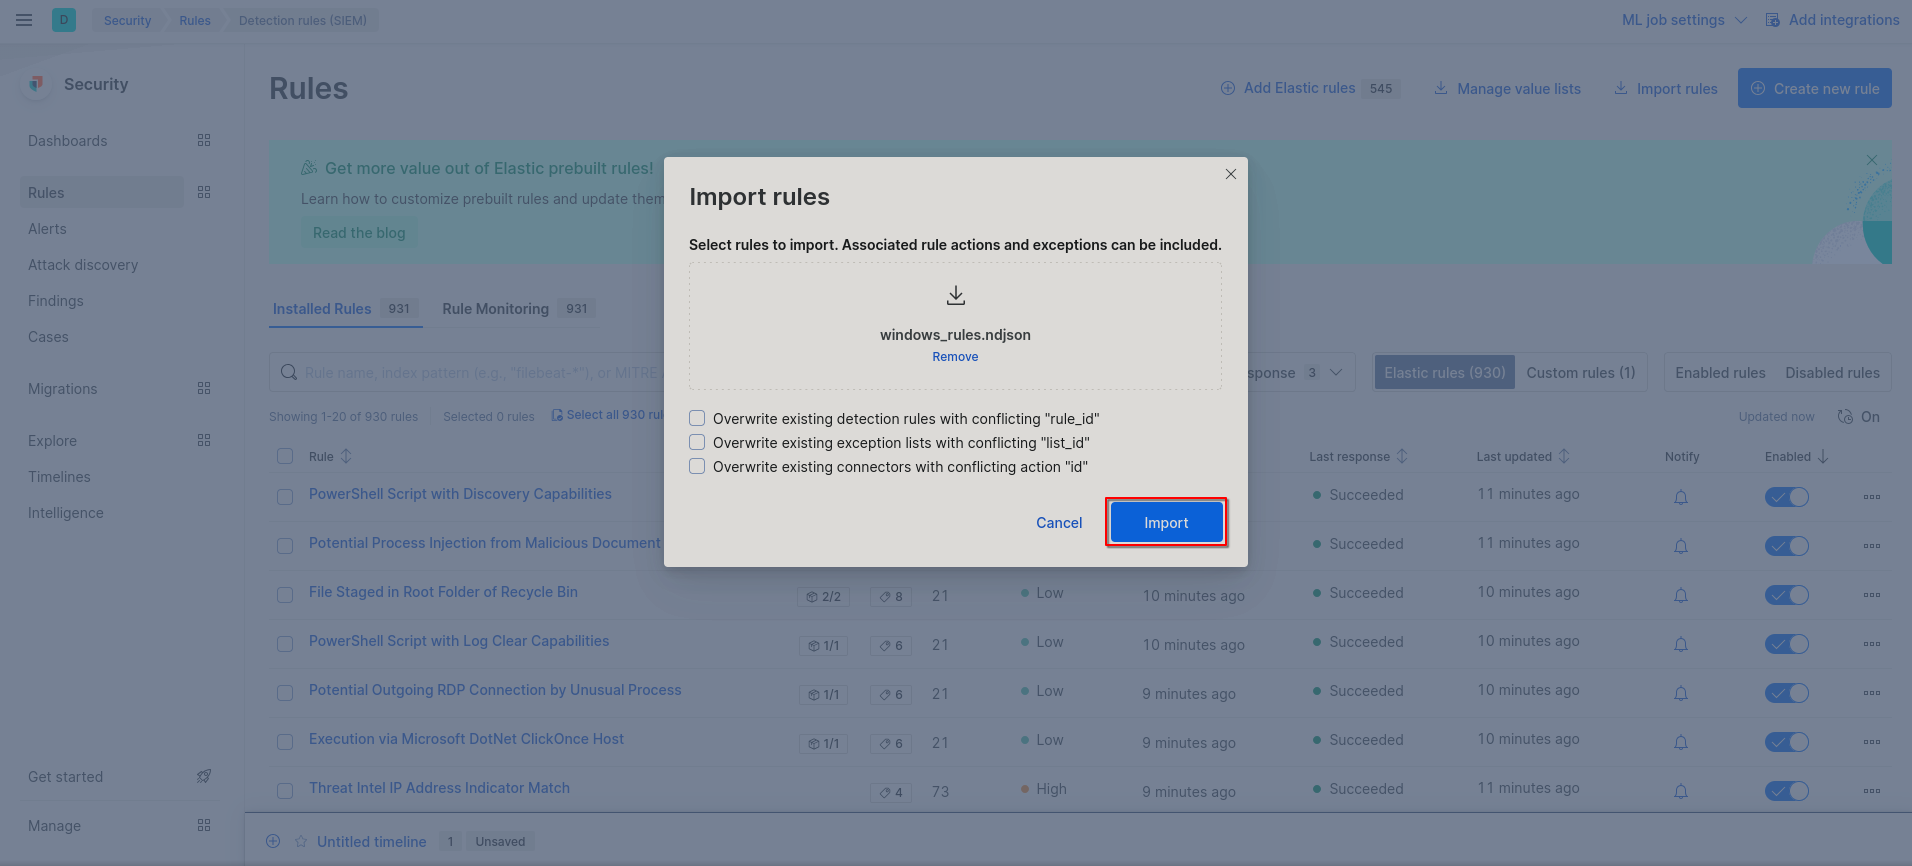
- Next click on “Import rules”.
- Now just drag and drop in your ndjson file, then click “Import”. That’s it!
Congratulations, you now have a fully working SIEM with Elastic search! Before you go about doing anything else, below you’ll find some basic hardening that you can do specific to elastic.
Hardening
Here we’ll be going over some admittedly basic hardening steps to do for your SIEM.
Configuring the Firewall
Solely for accessing the SIEM you only need the following ports open:
| Port Number | Service |
|---|---|
| TCP/9200 | Elastic Search |
| TCP/5601 | Kibana |
| TCP/8220 | Fleet |
You can drop all other traffic. However, if you access your server with ssh or have any other services that are running on the machine, make sure to add those to your firewall before dropping all other traffic and enabling the firewall.
Kibana Hardening
Due to some left over permissions of us setting up our own certificate, we should make sure that all the files in /etc/kibana are only accessible to root:kibana. Run ls -la /etc/kibana and ensure that all files are owned by root with the kibana group and that there are no read permissions for you certificate files, especially your key. You can change owner and group permissions with
$ sudo chown root:kibana /etc/kibana/<filename-here>
You can set the correct permissions for any file with the following command:
$ sudo chmod 660 /etc/kibana/<filename-here>